
Jargon, Decoded · Part 3 of 53
Reading an Income Statement (P&L), using a snacks company
What an income statement is
If the balance sheet is a photograph, the income statement — also called the P&L (profit and loss statement) — is the video. It shows what happened over a period (a quarter, a year), not on one specific day: how much the company sold, what it cost to sell it, and what was left over as profit.
It’s a waterfall — revenue at the top, a series of costs subtracted in a specific order, profit at the bottom. Each stopping point along the way tells you something different about the business.
The waterfall
| Line | What it means |
|---|---|
| Revenue | Total sales |
| − COGS (Cost of Goods Sold) | Cost of the raw material and direct production |
| = Gross Profit | What’s left after direct production costs |
| − Operating expenses | Selling, distribution, salaries, admin |
| = EBITDA | Earnings Before Interest, Tax, Depreciation & Amortisation — profit from core operations, before financing and accounting decisions |
| − Depreciation | The plant wearing out over time, spread across years |
| = EBIT | Earnings Before Interest & Tax — operating profit, after accounting for the plant ageing |
| − Interest | Cost of the company’s debt |
| = PBT | Profit Before Tax |
| − Tax | |
| = PAT | Profit After Tax — the actual bottom-line number, “net profit” |
Each subtraction removes a different kind of cost: first the cost of making the product, then the cost of running the business day-to-day, then the cost of the plant ageing, then the cost of borrowing, then the government’s share. What’s left at each stage is a genuinely different question — “is the product itself profitable?” (gross profit) is not the same question as “is the whole company profitable after everything?” (PAT).
Real companies usually have one more line: other income (interest earned on cash, for example), added in before PBT — so a real company’s PBT can be bigger than EBIT minus interest. Desi Bites has none, which keeps the arithmetic clean.
🧒 Explain it like I'm 10 (optional — skip if this is already clear)
Say you sell lemonade for ₹20 a glass. The lemons and sugar for each glass cost ₹8, so you keep ₹12 — that’s your gross profit. You also pay your little brother ₹3 a glass to help sell it, which leaves ₹9. If you borrowed money to build the stand, the interest comes out of that ₹9 too. What’s left after every cost is the only number that tells you what you actually get to keep.
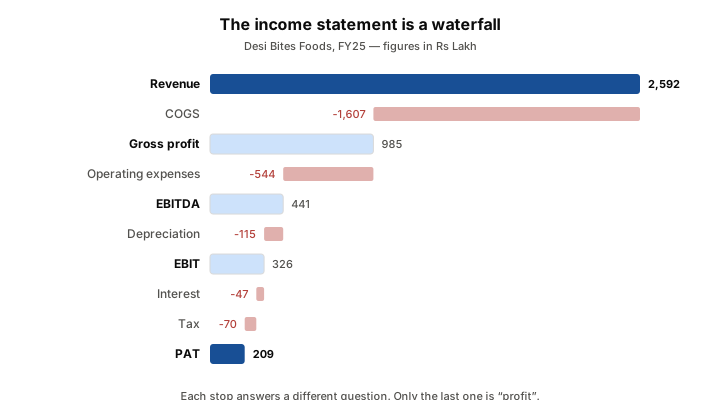
Desi Bites Foods, FY25 — the fictional case study, drawn to scale from the same figures used in the tables below. Illustration only.
Worked example: Desi Bites Foods, FY25
| ₹ Lakh | % of Revenue | |
|---|---|---|
| Revenue | 2,592 | 100% |
| COGS | 1,607 | 62.0% |
| Gross Profit | 985 | 38.0% |
| Operating expenses | 544 | 21.0% |
| EBITDA | 441 | 17.0% |
| Depreciation | 115 | 4.4% |
| EBIT | 326 | 12.6% |
| Interest | 47 | 1.8% |
| PBT | 279 | 10.8% |
| Tax | 70 | 2.7% |
| PAT (Net Profit) | 209 | 8.1% |
Out of every ₹100 of snacks Desi Bites sells, about ₹38 is left after paying for raw material, but only ₹8 makes it all the way down to actual profit, after running the business, depreciating the plant, paying interest on the loan, and paying tax. Every line in between is a real cost that a headline “revenue grew!” number conveniently skips over.
Full three-year version (FY23–FY25, showing margins improving as the business scales) is on the case study page.
Common mistakes
- Treating revenue growth as profit growth. A company can grow revenue while margins shrink — meaning it’s making less money per rupee of sales, even as the headline number looks better.
- Confusing EBITDA with actual profit. EBITDA ignores depreciation, interest, and tax — all real costs. It’s useful for comparing operating performance between companies with different debt loads or accounting choices, but it is not what the company actually keeps.
- Ignoring where in the waterfall a problem shows up. A company with healthy gross margin but weak PAT margin has a cost, financing, or tax problem below the operating line — a completely different issue than a company whose gross margin itself is thin.
- Looking at one year in isolation. A single year’s P&L doesn’t tell you whether a margin is stable, improving, or one good year in an otherwise shaky trend — that’s why the case study page shows three years, and we compare prior years where it matters.
Takeaway: an income statement is a waterfall from revenue down to profit, and every subtraction along the way answers a different question — reading only the top line (revenue) or the bottom line (PAT) skips the story of where the money actually went.
This post is for educational purposes only and is not investment advice. Wealth Primer explains concepts, not recommendations — nothing here is a suggestion to buy, sell, or hold any specific security or fund. The author is not a SEBI-registered Research Analyst or Investment Adviser. Any prices or figures used as worked examples are historical and shown only to illustrate a calculation. Past performance does not indicate future results. Please do your own research or consult a registered adviser before making investment decisions. See the privacy & disclaimer policy for more.