
Fundamental Analysis — Beginner to Expert · Part 1 of 29
DuPont: breaking ROE into the three things that actually drive it
Why a good ROE isn’t self-explanatory
ROE — return on equity — tells you how much profit a company earns on shareholders’ money. It’s the headline number a lot of investors check first, and for good reason. But on its own it’s a verdict without any reasoning attached. A 34% ROE could mean the company keeps a fat slice of every rupee it sells. It could mean thin margins but blistering sales volume on a small asset base. Or it could mean ordinary economics with a lot of borrowed money underneath.
Those are three very different businesses, and they carry very different risks. DuPont analysis — named after the chemical company whose finance team formalised it in the 1920s — pulls ROE apart into exactly those three pieces, so you can see which one is doing the work.
🧒 Explain it like I'm 10 (optional — skip if this is already clear)
Imagine two kids running lemonade stands, and both end the summer having doubled the money their parents lent them. Same result. But:
- The first kid sells a handful of cups at a huge markup. Big profit per cup.
- The second kid sells hundreds of cups at barely any profit each, using the same one table and jug all summer. Tiny profit per cup, but the table never sits idle.
- A third kid borrows extra money from an uncle to buy four more tables, and doubles the parents’ money mostly because most of the tables weren’t paid for by the parents at all.
All three “doubled the money.” DuPont is just the habit of asking which of those three kids you’re actually looking at — because if the third kid’s uncle wants his money back, that story ends very differently.
The formula
The whole thing rests on a bit of algebra where three fractions cancel out to leave you with ROE:
ROE = Net Margin  ×  Asset Turnover  ×  Equity Multiplier

        PAT           Revenue           Avg Assets          PAT
      ───────    ×   ──────────    ×   ────────────   =   ─────────
      Revenue        Avg Assets         Avg Equity        Avg Equity
Revenue cancels against revenue, average assets against average assets, and you’re left with PAT — Profit After Tax, the bottom line of the income statement — over average equity, which is just ROE. That’s the point: DuPont doesn’t add any new information, it re-expresses information you already have so the drivers become visible.
Each piece answers its own question, and each already has a post in this blog:
| Component | Question it answers | Post |
|---|---|---|
| Net margin | How much of each rupee of sales survives to the bottom line? | Profitability |
| Asset turnover | How much revenue does each rupee of assets generate? | Efficiency |
| Equity multiplier | How much of the asset base is funded by someone other than shareholders? | Leverage |
Read left to right, it’s profitability × efficiency × leverage.
One thing you have to get right first
The three components only multiply back to ROE if all three sit on the same averaging basis. ROE uses average equity, so the equity multiplier must use average assets over average equity too — not the closing-balance version.
This matters because the equity multiplier quoted in the earlier post uses closing balances, which is the more common convention when you’re looking at leverage on its own. Plug that number into DuPont and your product won’t tie out to the reported ROE, and you’ll waste an afternoon hunting a bug that isn’t there. Recompute it on averages for this exercise.
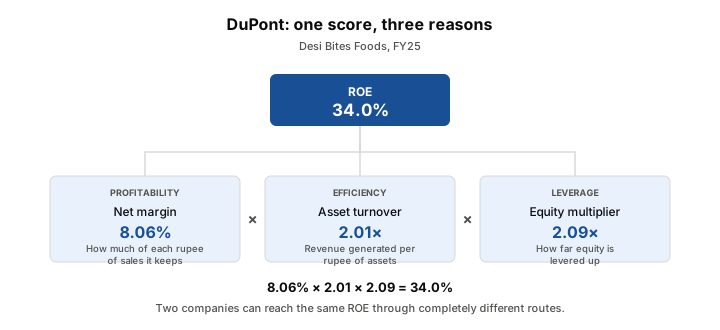
Desi Bites Foods, FY25 — the fictional case study, drawn to scale from the same figures used in the tables below. Illustration only.
Worked example: Desi Bites Foods, FY25
Using the FY25 figures from the case study (amounts in ₹ lakh):
| Component | Calculation | Value |
|---|---|---|
| Net margin | PAT 209 / Revenue 2,592 | 8.06% |
| Asset turnover | Revenue 2,592 / Avg assets 1,288.5 | 2.01x |
| Equity multiplier | Avg assets 1,288.5 / Avg equity 615.5 | 2.09x |
| ROE | 8.06% × 2.01 × 2.09 | 34.0% |
That ties back to the 34.0% ROE reported in the case study, which is the check you want before reading anything into the split.
Now the actual reading. Desi Bites earns a 34% ROE with a fairly modest 8.06% net margin. The heavy lifting comes from the other two: it turns its asset base over 2.01 times a year, and roughly half its assets are funded by lenders and suppliers rather than shareholders. This is a volume-and-leverage business, not a pricing-power business — which is exactly what you’d expect from a mid-sized namkeen manufacturer competing on shelf price.
Watch what happens when you track the split over time, though. On the same average basis used above, Desi Bites’ equity multiplier has been falling — 2.35x in FY23, 2.26x in FY24, 2.09x in FY25 — while ROE has been climbing from 20.4% to 34.0%. That’s the good kind of ROE growth: the returns improved even as the borrowed money propping them up shrank. An ROE rising because the equity multiplier is rising is a much less comfortable story.
Worked example: Britannia Industries, FY25
From Britannia’s audited consolidated FY25 results (year ended 31 March 2025, filed 8 May 2025; amounts in ₹ crore). For illustration only.
| Component | Calculation | Value |
|---|---|---|
| Net margin | PAT 2,178.73 / Revenue 17,942.67 | 12.14% |
| Asset turnover | Revenue 17,942.67 / Avg assets 8,956.06 | 2.00x |
| Equity multiplier | Avg assets 8,956.06 / Avg equity 4,148.62 | 2.16x |
| ROE | 12.14% × 2.00 × 2.16 | 52.5% |
Reading the two side by side
This is where DuPont earns its keep. Both companies sell packaged food. One posts a 34% ROE, the other 52.5%. Where does the gap actually come from?
| Component | Desi Bites | Britannia |
|---|---|---|
| Net margin | 8.06% | 12.14% |
| Asset turnover | 2.01x | 2.00x |
| Equity multiplier | 2.09x | 2.16x |
| ROE | 34.0% | 52.5% |
Asset turnover is effectively identical. Leverage is close. Practically the entire difference in ROE is net margin — Britannia keeps about 12.14 paise of every rupee of sales where Desi Bites keeps 8.06.
That’s a genuinely useful conclusion, and it’s one the raw ROE numbers couldn’t have given you. It says the gap between these two businesses isn’t about how hard they sweat their factories or how aggressively they borrow — it’s in the margin line, which is consistent with brand strength and scale. It also tells you where to look next: if you want to understand the difference, go read the gross margin and EBITDA margin posts again, not the leverage ones.
Common mistakes
- Mixing averaging bases. The single most common reason a DuPont decomposition refuses to reconcile. If ROE uses average equity, every component has to use averages too. Get the identity to tie out before you interpret anything.
- Treating a high equity multiplier as automatically bad. Leverage amplifies returns in both directions — it isn’t a flaw, it’s a choice with a risk attached. The question DuPont sets up is whether the returns justify that risk, which is what interest coverage and net debt/EBITDA are for. DuPont flags where to look; it doesn’t deliver the verdict.
- Reading one year in isolation. A single year’s split tells you the shape of the business. The trend in the split tells you whether ROE is improving for good reasons (margin or efficiency) or borrowed ones (leverage). The second question is usually the more important one.
- Comparing the split across unrelated industries. A software company and a steel plant will show wildly different margin-versus-turnover mixes by the nature of what they do. DuPont is at its sharpest comparing companies that do broadly similar things, or the same company across time.
- Stopping at three components when the ROE looks odd. There’s a five-step DuPont variant that splits net margin further into tax burden, interest burden, and operating margin — useful when you suspect a company’s ROE is being flattered by a one-off low tax rate rather than by the business itself.
Takeaway: ROE tells you how much a company earns on shareholders’ money; DuPont tells you why. Split it into margin, turnover and leverage, and check the three multiply back to the ROE you started with. Then the number stops being a scoreboard and becomes a diagnosis.
This post is for educational purposes only and is not investment advice. Wealth Primer explains concepts, not recommendations — nothing here is a suggestion to buy, sell, or hold any specific security or fund. The author is not a SEBI-registered Research Analyst or Investment Adviser. Any prices or figures used as worked examples are historical and shown only to illustrate a calculation. Past performance does not indicate future results. Please do your own research or consult a registered adviser before making investment decisions. See the privacy & disclaimer policy for more.