
Mutual Funds, Minus the Marketing · Part 1 of 23
Mutual fund NAV explained: why a ₹10 NAV isn't cheap
Pooling, in one paragraph
A mutual fund collects money from many investors, pools it, and buys a portfolio of securities with it. You don’t own the shares; you own units of the fund, and each unit represents a proportional slice of everything the fund holds. A professional manager (or, for an index fund, a rulebook) decides what’s in the portfolio, and an asset management company charges a fee for running it.
That’s the whole structure. Everything else in this series — returns, expenses, risk measures, SIPs — is bookkeeping laid on top of it.
NAV: what it is, and the thing everyone gets wrong
NAV — net asset value — is the per-unit value of the fund:
        Total value of the fund's assets − liabilities
NAV = ────────────────────────────────────────────────
                  Number of units outstanding
Indian mutual funds compute NAV once per business day, after markets close. Buy today and you get today’s NAV (subject to cut-off timing rules); there’s no intraday price the way there is for a stock.
Now the mistake. It is extremely common to hear that a fund with a ₹10 NAV is “cheap” and one with a ₹150 NAV is “expensive,” and that the ₹10 fund has “more room to grow.” This is completely wrong, and it’s worth being blunt about because the new-fund-offer marketing that exploits it is relentless.
NAV tells you nothing about value. It’s an arithmetic consequence of when the fund launched and how it has performed since. Invest ₹1,00,000 in a fund at ₹10 NAV and you get 10,000 units. Invest ₹1,00,000 at ₹150 NAV and you get 666.67 units. If both portfolios rise 10%, both your holdings are worth ₹1,10,000. The unit count differs; the money doesn’t.
Compare that to a share price, where the P/E ratio genuinely tells you something about what you’re paying for a claim on earnings. A fund’s NAV has no equivalent meaning — the fund’s holdings are marked at market value every day, so the NAV is already exactly what the underlying is worth.
🧒 Explain it like I'm 10 (optional — skip if this is already clear)
Imagine a giant pizza that a hundred people paid for together.
The NAV is the price of one slice. But here’s the thing — how big the slices are was decided arbitrarily on day one. One pizza shop cuts it into 100 slices, another cuts an identical pizza into 1,000 tiny ones.
The shop with tiny slices isn’t cheaper. You just need more slices to get the same amount of pizza. If you spend ₹500 at either shop, you go home with exactly the same amount of pizza.
So “this fund’s NAV is only ₹10, it’s cheap!” is like saying a pizza is better value because it’s been cut into smaller pieces.
The fund this series uses
Every calculation in the next eight posts runs on one real fund, so you can reproduce all of it:
| Fund | UTI Nifty 50 Index Fund |
| Category | Index Fund (Nifty 50) |
| Plans used | Regular Plan - Growth (AMFI scheme code 100822), Direct Plan - Growth (AMFI scheme code 120716) |
| History | 2006-04-03 to 2026-03-31 (20.0 years, 4,915 NAV points) |
| Source | AMFI NAV history via mfapi.in |
| Download | uti-nifty50-index-fund-nav.csv |
Three deliberate choices.
It’s an index fund. It simply tracks the Nifty 50, so no post in this series has to make a claim about whether some manager is skilled. That keeps the focus on the arithmetic, which is what’s actually being taught.
Twenty years of it. The history starts in April 2006, which means it contains both the 2008 crash and the 2020 one. Most fund marketing shows you a period chosen to exclude events like those. This series includes them because they’re the interesting part.
It’s old data. The series ends 31 March 2026, more than six months before this post publishes. That’s a rule this blog follows for worked examples, and it means nothing here can be read as a view on current markets.
Twenty years, on a log scale
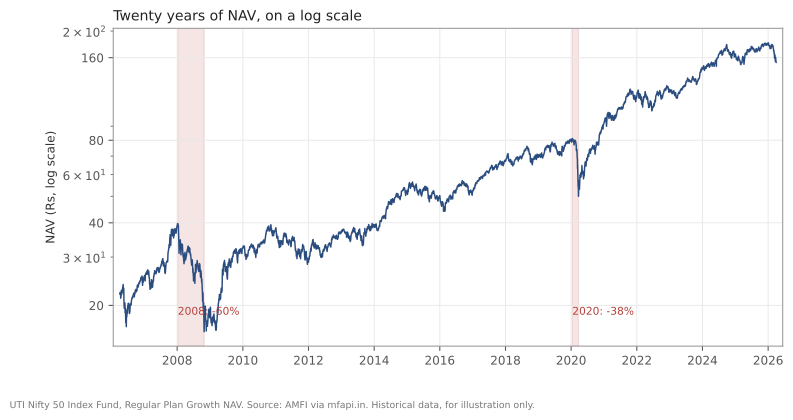
Source: AMFI, the Association of Mutual Funds in India, via mfapi.in — UTI Nifty 50 Index Fund, Regular Plan - Growth (AMFI scheme code 100822). Historical data, for illustration only.
NAV went from ₹22.0557 to ₹153.8204 over twenty years. Note the log scale — on a log axis, equal vertical distances are equal percentage moves, which is the honest way to show anything that compounds. On a linear axis, the 2008 crash would look like a small notch near the bottom and the recent years would dominate. It was a 60% fall, and the chart should show it as one.
The vocabulary you’ll meet
| Term | What it means |
|---|---|
| AUM | Assets under management — total money in the fund |
| Units | Your proportional share of the pool |
| Growth option | Gains stay in the fund; NAV rises |
| IDCW option | Income distribution cum capital withdrawal — payouts, and NAV drops by the amount paid |
| Direct plan | Bought straight from the AMC; no distributor commission |
| Regular plan | Bought via a distributor, whose commission is inside the expense ratio |
| Expense ratio | Annual fee, deducted daily from NAV |
| Exit load | A charge for redeeming before a set period |
Two of these deserve flags now.
IDCW is not “dividend income.” It used to be called the dividend option, and the rename was an improvement, because the money isn’t a return on top of your investment — it’s paid out of your own NAV, which falls by the same amount. It’s taxable in your hands at your slab rate. Many people choose IDCW believing it produces extra income; it produces the same money, sooner, taxed less favourably — each payout is taxed at your slab rate in the year it’s paid, while growth-option gains are taxed only when you redeem, and then at capital-gains rates.
The expense ratio is already inside the NAV. You’ll never see it charged. Every NAV in that chart is after fees. The post on expense ratios later in this series shows exactly what that invisible deduction costs over time, and the answer is larger than it looks.
Doing it in Python
import pandas as pd

nav = pd.read_csv("uti-nifty50-index-fund-nav.csv",
                  parse_dates=["date"]).set_index("date")
r = nav.nav_regular_growth.dropna()

print(f"{len(r)} NAV points, {r.index[0].date()} to {r.index[-1].date()}")
print(f"NAV: {r.iloc[0]:.2f} -> {r.iloc[-1]:.2f}")

# Rs 1,00,000 invested at the start
units = 100000 / r.iloc[0]
print(f"{units:,.2f} units, worth Rs {units * r.iloc[-1]:,.0f} at the end")
Note what that last calculation doesn’t need: the NAV level. Units times final NAV equals value, and any fund with the same percentage return gives the same answer regardless of whether its NAV is ₹10 or ₹500.
Common mistakes
- Thinking a low NAV means a cheap fund. The single most exploited misconception in Indian fund marketing. NAV level carries no information about value or future returns.
- Believing a new fund offer at ₹10 is a ground-floor opportunity. A new fund starts at ₹10 by convention. It has no track record, which is a disadvantage, not an entry price.
- Choosing IDCW for “regular income.” The payout comes out of your NAV and is taxed at your slab rate.
- Comparing NAVs of two different funds. Meaningless. Compare returns over identical periods.
- Forgetting returns are already net of expenses. Every NAV is post-fee, which is why the fee is so easy to ignore.
- Assuming today’s NAV applies whenever you invest. Cut-off timings and fund-realisation rules decide which day’s NAV you get.
Takeaway: A mutual fund pools money and gives you units of a portfolio, and NAV is just that portfolio’s value divided by the units outstanding — an accident of launch date and history, not a price tag. A ₹10 NAV is not cheap and a ₹150 NAV is not expensive; ₹1,00,000 buys exactly ₹1,00,000 of the same portfolio either way.
This post is for educational purposes only and is not investment advice. Wealth Primer explains concepts, not recommendations — nothing here is a suggestion to buy, sell, or hold any specific security or fund. The author is not a SEBI-registered Research Analyst or Investment Adviser. Any prices or figures used as worked examples are historical and shown only to illustrate a calculation. Past performance does not indicate future results. Please do your own research or consult a registered adviser before making investment decisions. See the privacy & disclaimer policy for more.