
Mutual Funds, Minus the Marketing · Part 2 of 23
Point-to-point returns: the same fund, from 2.6% to 23.9% a year
The number on every factsheet
Open any fund factsheet, advertisement or app screen and you’ll see something like “5-year return: 14.2%” against the NAV you’re buying at. That’s a point-to-point return — take the NAV on one date, the NAV on another, and annualise the change between them.
It’s the standard way returns get quoted. It’s also, on its own, close to useless for judging anything, and this post is about why.
The formula
For periods under a year, the plain change is used. Beyond a year, returns are annualised as CAGR — compound annual growth rate:
              ⎛ Ending NAV ⎞^(1/years)
CAGR =        ⎜────────────⎟            − 1
              ⎝ Starting NAV⎠
CAGR answers: “what constant annual rate would have taken me from the start value to the end value?” It is a real and correct calculation. The problem isn’t the arithmetic — it’s that the arithmetic depends entirely on two dates that somebody chose.
🧒 Explain it like I'm 10 (optional — skip if this is already clear)
Suppose you want to know how fast a car goes. You measure it between two lamp-posts and work out the speed.
But which lamp-posts? If you measure across a stretch that starts at a red light, you’ll get a low speed. Measure a stretch on the open motorway and you’ll get a high one. Same car, same day.
If the person choosing the lamp-posts is also the person trying to sell you the car, you can guess which stretch they’ll pick.
Five windows, one fund
Here is the same fund, the same five-year holding period, five different start months:
| Window | 5-year CAGR |
|---|---|
| 5 years from Jan 2007 (just before the crash) | 2.56% |
| 5 years from Jan 2009 (just after it) | 15.51% |
| 5 years from Jan 2015 | 9.03% |
| 5 years from Apr 2020 (the COVID low) | 23.92% |
| 5 years from Jan 2021 | 14.25% |
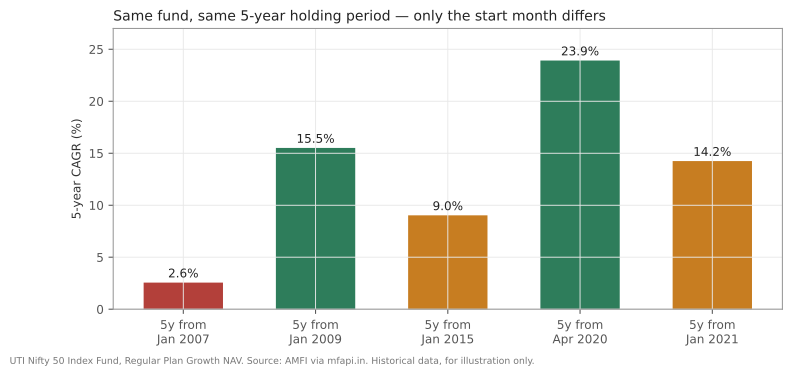
UTI Nifty 50 Index Fund, Regular Plan - Growth (AMFI scheme code 100822). Source: AMFI via mfapi.in. Historical data, for illustration only.
The spread is 21.4 percentage points a year. Nothing about the fund changed between those windows — it’s an index fund, tracking the same fifty companies under the same rules throughout. The manager didn’t get better. The strategy didn’t change.
The only thing that varied was the month someone started measuring.
Look at the first two rows in particular. Start in January 2007 and five years of investing returned 2.56% a year — worse than a savings account. Move the start date forward by exactly two years, to January 2009, and the same five-year holding period returned 15.51% a year. The difference is entirely that the first window began just before a 60% crash and the second began just after it.
Why this matters more than it seems
Two practical consequences.
Advertised returns are chosen, not given. A fund can honestly quote any of those numbers. Nothing in the arithmetic is wrong. But “our 5-year return is 15.5%” and “our 5-year return is 2.6%” can both be true statements about the same fund, made on different days, and the marketing department is not going to pick at random.
Regulation helps here — SEBI requires standardised return disclosure across fixed periods — but the underlying problem doesn’t disappear. A 1-year, 3-year and 5-year return quoted as of today are still three windows all ending on the same date.
Recent returns look best after a good run. This is the trap that catches retail investors most reliably. Funds attract the most money right after the period in which they performed best, because that’s when their trailing numbers look most impressive — which is precisely when the starting point for your window is highest.
Look at the Apr 2020 row: 23.92% a year. That window starts at the COVID crash low. Anyone quoting it in 2025 was quoting a real number, and anyone investing on the strength of it was starting their own five-year window somewhere very different.
What the fund actually did
Worth stating plainly, since we’ve been slicing: across the whole 20 years of available history, the fund returned 10.2% a year.
That’s also a point-to-point number, with all the same problems. It starts in April 2006 near a market high and ends on 31 March 2026 after a weak quarter. It is neither more nor less “correct” than the five above.
The fix isn’t to find the one honest window. It’s to stop relying on any single window — which is what the next post is about.
Doing it in Python
import pandas as pd

nav = pd.read_csv("uti-nifty50-index-fund-nav.csv",
                  parse_dates=["date"]).set_index("date")
r = nav.nav_regular_growth.dropna()

def cagr(series, start, end):
    a, b = pd.Timestamp(start), pd.Timestamp(end)
    # .asof() takes the last NAV on or before the date — NAVs skip weekends
    years = (b - a).days / 365.25
    return ((series.asof(b) / series.asof(a)) ** (1 / years) - 1) * 100

for s, e in [("2007-01-01", "2012-01-01"), ("2009-01-01", "2014-01-01"),
             ("2020-04-01", "2025-04-01")]:
    print(f"{s} -> {e}: {cagr(r, s, e):.2f}%")
asof() is doing real work there. NAVs don’t exist on weekends and holidays,
so asking for “the NAV on 1 January” needs a rule for what to do when there
isn’t one. Taking the last published NAV on or before the date is the
standard convention, and forgetting to handle it is a common source of wrong
numbers.
Common mistakes
- Treating a quoted return as a property of the fund. It’s a property of the fund and two dates, and you were shown the dates someone chose.
- Comparing funds over different windows. A 5-year return for one fund and a 3-year return for another is not a comparison at all.
- Chasing the best trailing numbers. Those are highest right after the run that produced them, which is when your own entry point is worst.
- Confusing CAGR with what you actually experienced. CAGR is a smoothed average. A fund that returned +50% then −20% has a CAGR near 9.5%, and no year in which anything like 9.5% happened.
- Annualising short periods. “Up 8% in three months, so 32% annualised” is not a projection, it’s an extrapolation of noise.
- Forgetting the window includes the fee. Every NAV is post-expense, so quoted returns are net — one thing the number does get right.
Takeaway: A point-to-point return is a correct calculation between two dates that somebody selected, and on this one index fund those dates swing the answer from 2.56% to 23.92% a year for the identical five-year holding period. The number isn’t a lie; it’s just a description of a window, and whoever picked the window has already made most of the argument.
This post is for educational purposes only and is not investment advice. Wealth Primer explains concepts, not recommendations — nothing here is a suggestion to buy, sell, or hold any specific security or fund. The author is not a SEBI-registered Research Analyst or Investment Adviser. Any prices or figures used as worked examples are historical and shown only to illustrate a calculation. Past performance does not indicate future results. Please do your own research or consult a registered adviser before making investment decisions. See the privacy & disclaimer policy for more.