
Mutual Funds, Minus the Marketing · Part 3 of 23
Rolling returns in mutual funds: how to calculate them
The fix
The last post showed the same index fund returning anywhere from 2.56% to 23.92% a year over five-year windows, depending only on the start month. The problem was that any single window is a choice.
Rolling returns remove the choice. Instead of picking one start date, compute the return for every possible start date, then look at the whole distribution.
Take every day in the fund’s history, measure the five-year return from that day, and you get thousands of five-year returns rather than one. Now you can ask much better questions: what was the worst? How often was it negative? How wide is the spread?
The formula
There isn’t a new one — it’s the same CAGR, applied repeatedly:
For each start date d in the fund's history:
    if d + N years is within the data:
        rolling_return(d) = CAGR from NAV(d) to NAV(d + N years)

Then describe the resulting distribution: min, median, max,
and the share of windows below whatever threshold you care about.
The output isn’t a number. It’s a distribution, and that’s the entire point.
🧒 Explain it like I'm 10 (optional — skip if this is already clear)
Back to measuring the car between lamp-posts.
Instead of arguing about which two lamp-posts are fair, you measure the speed between every pair of lamp-posts that are five kilometres apart. Hundreds of measurements.
Now you can say something much more useful than “the car does 80”: “across every five-kilometre stretch, it did between 45 and 110, and usually about 75.”
That’s a description of the car. The single number was a description of one stretch of road.
The distribution
Every possible start date in 20 years of this fund’s history:
| Holding period | Windows | Worst | Median | Best | % negative | % below 8% |
|---|---|---|---|---|---|---|
| 3 years | 4,180 | −4.82% | 11.82% | 31.95% | 2.9% | 27.9% |
| 5 years | 3,685 | −1.58% | 12.25% | 26.14% | 1.5% | 23.8% |
| 7 years | 3,192 | 3.57% | 11.66% | 18.29% | 0.0% | 15.4% |
| 10 years | 2,453 | 4.39% | 11.81% | 16.11% | 0.0% | 14.0% |
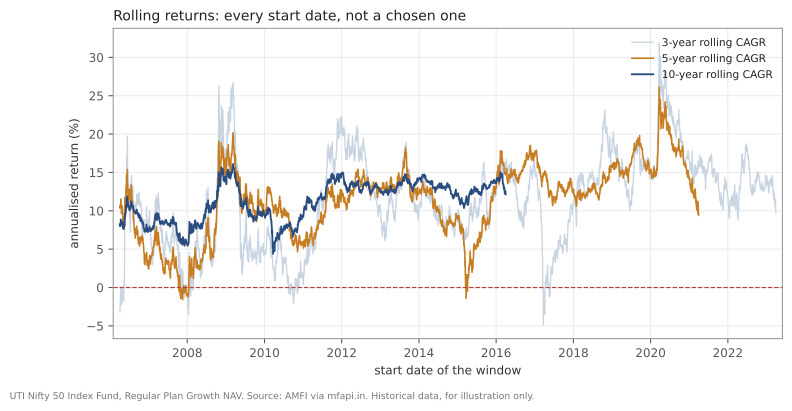
UTI Nifty 50 Index Fund, Regular Plan - Growth (AMFI scheme code 100822). Source: AMFI via mfapi.in. Historical data, for illustration only.
Read the table column by column, because there are three separate findings in it.
The median barely moves. 11.82%, 12.25%, 11.66%, 11.81% — essentially the same number at every holding period. Holding longer did not raise the typical return.
The range collapses. Three-year windows ran from −4.82% to 31.95% — a spread of nearly 37 percentage points. Ten-year windows ran from 4.39% to 16.11%, a spread of under 12. The dispersion of outcomes shrank dramatically.
Negative outcomes disappear. 2.9% of three-year windows lost money. By seven years, none did.
Put together, that’s the honest case for holding equity for long periods — and notice it is not the case usually made. Time in the market didn’t improve the typical outcome. It narrowed the range of outcomes. You were not more likely to do well; you were less likely to do badly.
The uncomfortable column
Look again at “% below 8%”. Even at ten years, 14% of windows returned less than 8% a year — roughly what a 1–3 year bank fixed deposit paid (pre-tax) for much of this period, with none of the volatility.
That column doesn’t appear in fund marketing, and it should. The rolling data supports “equity was rarely a loss over long periods.” It does not support “equity always beat safe alternatives.” Both statements are about the same distribution, and only one of them gets printed.
A discrepancy worth understanding
The last post gave the fund’s whole-period return as 10.2% a year. But the median 5-year rolling return here is 12.25% — a gap of about two percentage points.
Both are correct. The whole-period figure is a single window that happens to begin near an April 2006 high and end just after a weak Q1 2026. The rolling median describes the middle of thousands of windows.
That gap is the argument for rolling returns, in a single comparison. If one carefully-computed number can sit two points away from the typical experience, you should not be making decisions on one carefully-computed number.
Doing it in Python
import pandas as pd

nav = pd.read_csv("uti-nifty50-index-fund-nav.csv",
                  parse_dates=["date"]).set_index("date")
r = nav.nav_regular_growth.dropna()

def rolling_cagr(series, years):
    out = {}
    for date, start_nav in series.items():
        end = date + pd.DateOffset(years=years)
        if end > series.index[-1]:
            break
        out[date] = ((series.asof(end) / start_nav) ** (1/years) - 1) * 100
    return pd.Series(out)

for y in (3, 5, 7, 10):
    rc = rolling_cagr(r, y)
    print(f"{y:2d}y: {len(rc):5d} windows  "
          f"min {rc.min():6.2f}  median {rc.median():6.2f}  max {rc.max():6.2f}  "
          f"negative {100*(rc < 0).mean():4.1f}%")
Two details that matter. DateOffset(years=y) handles calendar years
correctly, including leap years — don’t use a fixed number of days. And
break rather than continue works because the index is sorted: once a
window runs past the end of the data, every later one does too.
Common mistakes
- Rolling monthly instead of daily and calling it the same thing. Monthly start dates give roughly a twentieth of the windows (there are about 20 NAV days a month) and can miss short sharp episodes entirely. State your step size.
- Quoting only the median. The distribution is the output. A median without the range and the worst case throws away most of the information.
- Assuming the historical range bounds the future. This fund’s worst 10-year window was 4.39%. That is a fact about 2006–2026, not a floor.
- Comparing rolling returns computed over different total histories. A fund launched in 2015 has never seen a 2008. Its rolling distribution isn’t comparable to one that has.
- Concluding that longer holding raises returns. The median hardly moved. What changed was dispersion.
- Ignoring the below-8% column because it’s inconvenient. It’s the same data as the reassuring columns.
Takeaway: Rolling returns compute the outcome from every possible start date instead of one, turning a single quotable number into a distribution you can actually interrogate. On this fund the median return barely changed with holding period while the range collapsed and losses vanished after seven years — which means time in the market bought consistency, not a higher return.
This post is for educational purposes only and is not investment advice. Wealth Primer explains concepts, not recommendations — nothing here is a suggestion to buy, sell, or hold any specific security or fund. The author is not a SEBI-registered Research Analyst or Investment Adviser. Any prices or figures used as worked examples are historical and shown only to illustrate a calculation. Past performance does not indicate future results. Please do your own research or consult a registered adviser before making investment decisions. See the privacy & disclaimer policy for more.