
Fundamental Analysis — Beginner to Expert · Part 10 of 29
Desi Bites cooks the books: four tricks and the ratios that catch them
Two sets of accounts for the same year
Everything in this post is invented. Desi Bites Foods is fictional, and the “dressed” FY26 below never happened even in the fiction — it’s the same business, the same cash, the same customers, with four cosmetic decisions layered on by an imaginary management that wanted its first year as a listed company to look better than it was. No real company is being described, and the point is not that companies routinely do this. The point is that each trick can be made to look defensible, each one makes the statements look better, and each one leaves a fingerprint that a reader with the ratios from this blog’s first module can find.
The honest FY26 is the one the previous post introduced. Here is what management could have done instead.
The four tricks
| Trick | What was done | Which line it flatters |
|---|---|---|
| 1. Channel stuffing | Shipped ₹150 lakh of stock to distributors in the last week of March that nobody ordered, booked as sales | Revenue, gross profit, PAT |
| 2. Capitalising expenses | Booked ₹60 lakh of marketing and repairs as “plant and equipment” instead of expensing it | Opex down, EBITDA up, capex up |
| 3. Related-party asset sale | Sold old machinery with a book value of ₹20 lakh to a promoter-owned firm for ₹55 lakh; the gain sits in “other income” | Other income, PBT (profit before tax) |
| 4. Provision write-back | Reversed ₹20 lakh of accrued expenses through the P&L | Opex down, EBITDA up |
None of these involves a missing rupee, and each comes with a ready explanation. Don’t mistake that for legality. Booking stock nobody ordered as a sale fails Ind AS 115 — with no customer who agreed to buy, there’s no revenue to recognise — and that’s exactly why revenue cut-off is a standard key audit matter. Capitalising advertising is barred outright by Ind AS 38, and routine repairs are an expense under Ind AS 16. As described, Tricks 1 and 2 are misstatements, not judgement calls. Trick 3 is a real transaction at a generous price, and Trick 4 is an estimate being revised; those two sit closer to the line, and the question is whether the price and the estimate were honest. What makes all four worth learning: the frauds that make headlines are usually these, done bigger and for longer.
Side by side
₹ lakh, FY26:
| Honest | Dressed | Change | |
|---|---|---|---|
| Revenue | 3,299 | 3,449 | +150 |
| Operating expenses | 708 | 628 | −80 |
| EBITDA | 547 | 684 | +137 |
| EBITDA margin | 16.6% | 19.8% | |
| Other income | 85 | 120 | +35 |
| PAT | 301.5 | 427.5 | +126 |
| EPS (₹) | 24.12 | 34.2 | |
| PAT growth on FY25 | 44.3% | 104.5% |
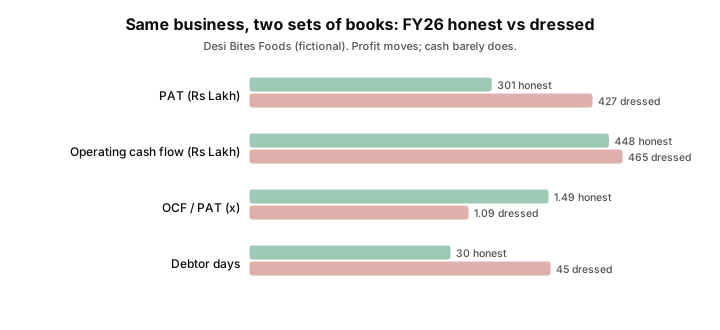
The honest year was already good: PAT up 44.3%. The dressed year reports PAT more than doubling. Every rupee of the difference is presentation. The plant made the same namkeen and the same customers paid for it.
🧒 Explain it like I'm 10 (optional — skip if this is already clear)
Say you run a lemonade stand and your parents pay you based on your profit for the summer.
You could sell more lemonade. Or, on the last day, you could pour fifty cups and leave them with your friends, saying “pay me whenever” — and count all fifty as sold. Your “sales” jump. The money doesn’t arrive.
You could also decide that the money you spent on posters wasn’t really a cost — it was an “investment in the brand” — and leave it out of your expenses. Profit goes up. The money is still gone.
Your parents, if they’re sharp, will ask one question: how much cash is actually in the jar? That question is what the rest of this post is about.
The fingerprints
Each trick moves a P&L line. But the balance sheet and cash flow statement have to keep balancing — the model behind this post asserts that both versions do — and that is what leaves the marks. The cash flow post called cash the statement that’s hardest to fake; here is what that means in practice.
| Check | Honest | Dressed | What it catches |
|---|---|---|---|
| OCF/PAT | 1.49x | 1.09x | Profit rose 41.8%; operating cash rose 3.8%. Tricks 1, 3 and 4 inflate profit without producing operating cash. Trick 2 actually flatters OCF; it shows up in capex intensity and free cash flow instead |
| Debtor days | 30 | 45 | Trick 1. Stuffed channels don’t pay; receivables balloon against a 30-day credit policy |
| Inventory days | 56 | 37 | Trick 1’s mirror image. Stock “sold” in March leaves the warehouse, so inventory looks lean — a fall that’s too good |
| Capex intensity | 7.4% | 8.8% | Trick 2. Capex jumps while the MD&A mentions no new capacity; the “asset” is last year’s advertising |
| Other income ÷ PBT | 21.2% | 21.0% | Trick 3 hides here — same share, different nature. The notes reveal a gain on sale to a related party |
| Gross margin | 38.0% | 38.0% | Unchanged — stuffing adds revenue and cost. Not every ratio catches every trick |
The honest inventory days sit above FY25’s 48 for an innocent reason: the company bought on 1 October 2025 brings its full stock into the year-end balance but only six months of cost of goods sold into FY26.
Read the first row twice. OCF/PAT is the single most useful forensic ratio because almost every way of flattering profit fails to flatter cash. Channel stuffing books revenue nobody has paid for. A gain on selling an asset is non-cash from the operating statement’s point of view (the proceeds sit in investing). A written-back provision is a book entry; no cash comes in. The exception is capitalising an expense: it moves the cash outflow from operating to investing, so operating cash actually looks better — the cash still leaves, just under a different heading, which is why capex intensity and free cash flow catch it instead. Net of all four, profit goes up and operating cash barely moves, and the ratio collapses from 1.49x to 1.09x.
One year of OCF/PAT near 1 is unremarkable — working capital swings do that. A fall in OCF/PAT in the same year profit jumps is the pattern.
The one that doesn’t show in a ratio
Trick 3 — the related-party sale — has the same “other income as a share of PBT” in both versions, because the honest year also has a big other-income line (interest on the IPO cash). The ratio doesn’t catch it. The note does. Ind AS 24 requires every transaction with a related party to be listed: counterparty, relationship, amount. A line reading sale of plant and equipment to an entity controlled by the promoter, ₹55 lakh, carrying value ₹20 lakh is the whole story in one row.
That’s the general lesson of this module. Ratios are the smoke detector. The notes are where you find the fire. A related-party note that is long, or that grew this year, or that involves the promoter’s relatives’ businesses buying and selling things at odd prices, deserves more of your time than any single ratio.
Why this works on people
Because every number in the dressed accounts is defensible. The distributors did receive the stock. Marketing does build a long-lived brand. The machine was sold. The provision was an estimate. An analyst who asks will get a plausible answer to each question separately. The pattern only appears when you look at the four together, alongside the cash flow statement, and notice that a company reporting its best-ever profit generated roughly the same cash as it would have on a normal year.
There is also a tell in the timing. Trick 1 happens in the last week of the year; trick 4 happens at year-end when estimates are revisited. A quarterly pattern where Q4 is always the strongest quarter, and Q1 is always weak because the channel is full, is worth a look — the next post is about reading quarters.
Common mistakes
- Checking P&L ratios only. Margins and growth are the targets of window-dressing. The evidence is on the balance sheet (receivables, fixed assets) and in the cash flow statement.
- Treating one soft OCF/PAT year as a red flag. Working capital is lumpy. The signal is a fall in cash conversion coinciding with a jump in profit, not a single reading.
- Assuming the auditor would have caught it. Each of these four comes with a plausible story, and an audit is a sample, not a re-run of every entry. Auditors do test revenue cut-off and sample capex additions, but a sample can miss a well-papered March shipment or a repair bill filed under “plant”; and they rarely second-guess the price a promoter’s brother paid for a machine.
- Being reassured by an improving ratio. Inventory days fell in the dressed version. Too-good-to-be-true works in both directions.
- Ignoring “other income.” For a snacks company, interest and gains on asset sales aren’t the business. Strip them out before judging the year: Desi Bites’ honest PAT excluding other income and the one-off charge is ₹264 lakh, not ₹301.5 lakh.
- Thinking this only happens at small companies. Size changes the zeroes, not the techniques.
Takeaway: A few defensible-looking tricks can turn a good year into a spectacular one on paper while operating cash barely moves — and that gap is the tell. OCF/PAT, debtor days and the related-party note catch what the P&L was built to hide. Profit is an opinion; cash is closer to a fact.
This post is for educational purposes only and is not investment advice. Wealth Primer explains concepts, not recommendations — nothing here is a suggestion to buy, sell, or hold any specific security or fund. The author is not a SEBI-registered Research Analyst or Investment Adviser. Any prices or figures used as worked examples are historical and shown only to illustrate a calculation. Past performance does not indicate future results. Please do your own research or consult a registered adviser before making investment decisions. See the privacy & disclaimer policy for more.