
Technical Analysis — Zero to Hero · Part 3 of 22
Support and resistance: the price levels that keep mattering
Prices have memory
The candlestick post was about reading a single session. This one zooms out. Look at enough charts and you notice something odd: prices stop falling at roughly the same level more than once, and stall on the way up at roughly the same level more than once. The levels aren’t random, and they persist for months.
- Support is a price area where falling tends to stop — enough buyers show up to absorb the selling.
- Resistance is a price area where rising tends to stall — enough sellers show up to absorb the buying.
The mechanism isn’t mystical. It’s memory. People remember what they paid, what they wished they’d paid, and where they got hurt. Someone who bought at ₹6,200 and watched it fall to ₹5,700 is often waiting to get out “at break-even” — and that waiting creates real selling pressure whenever the price returns to ₹6,200. Multiply by thousands of participants and the level becomes self-reinforcing.
🧒 Explain it like I'm 10 (optional — skip if this is already clear)
Imagine bouncing a ball in a room.
The floor is support — the ball keeps coming down and bouncing back up off it. The ceiling is resistance — throw the ball up and it keeps hitting the same spot and coming back.
Now, the room isn’t made of concrete. If you throw hard enough, the ball goes through the ceiling. And here’s the strange part: once it’s through, that old ceiling becomes the new floor for the ball bouncing around upstairs.
That’s the whole idea, including the part where it breaks.
They’re zones, not lines
This is the single most common way beginners get support and resistance wrong. Textbooks draw a crisp horizontal line at an exact price. Real charts don’t cooperate.
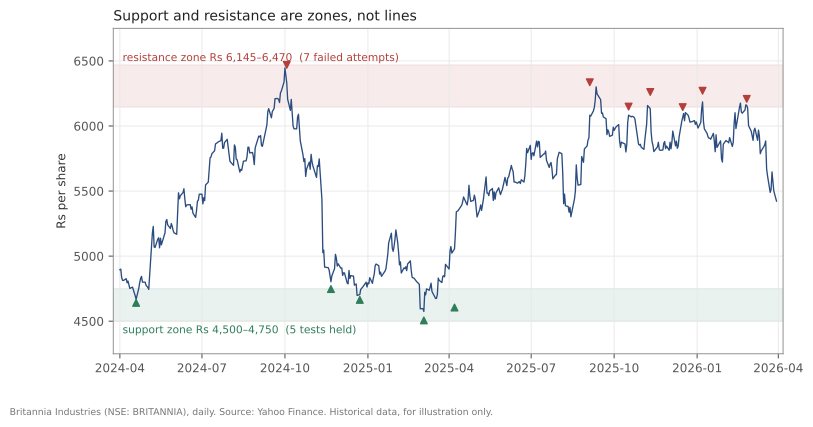
Britannia (NSE: BRITANNIA), daily bars, 1 April 2024 to 30 March 2026. Source: Yahoo Finance. Historical data, for illustration only.
Two areas stand out across these two years.
Resistance, roughly ₹6,145–₹6,470. Seven separate swing highs landed in this band, spread across seventeen months:
| Date | High reached |
|---|---|
| 2024-10-03 | ₹6,469.9 |
| 2025-09-04 | ₹6,336 |
| 2025-10-17 | ₹6,149 |
| 2025-11-10 | ₹6,261.5 |
| 2025-12-16 | ₹6,145 |
| 2026-01-07 | ₹6,271 |
| 2026-02-25 | ₹6,208.5 |
Support, roughly ₹4,500–₹4,750. Five separate swing lows found buyers here:
| Date | Low reached |
|---|---|
| 2024-04-19 | ₹4,641 |
| 2024-11-21 | ₹4,746.9 |
| 2024-12-23 | ₹4,663.8 |
| 2025-03-04 | ₹4,506 |
| 2025-04-07 | ₹4,605.1 |
Notice the spread. The resistance highs run from ₹6,145 to ₹6,469.9 — a range of over ₹300, or about 5%. Anyone who had drawn a precise line at ₹6,200 would have been “wrong” on most of those touches. The useful object is the band, and the useful question is “is price approaching the area where it has repeatedly struggled,” not “has it hit ₹6,200.00.”
What counts as a real level
Not every place a price paused is meaningful. Three things make a level worth taking seriously:
- Number of touches. One reversal is an event. Five is a pattern. The resistance zone above was tested seven times.
- How much time it spans. A level respected across seventeen months reflects more accumulated memory than one respected over a fortnight.
- Volume at the level. Heavy trading around a price means many people have a position established there — and therefore an opinion when it returns. The volume post later in this series picks this up.
A level nobody traded much at, touched twice last week, is mostly noise.
When a level breaks
Levels do break — that’s the whole reason a chart ever goes anywhere. The conventional idea about what happens next is worth knowing, and worth holding loosely.
Role reversal: when resistance breaks, it’s supposed to become support, and vice versa. The logic follows from the memory story — everyone who sold at the old ceiling now watches it become the floor, and some of them buy it back.
This dataset can’t test role reversal cleanly — neither zone was ever decisively broken and then retested from the other side. What it does show is how loosely a level holds. The ₹4,500–4,750 support zone held five times. But look at the 4 March 2025 low of ₹4,506 — it broke below the prior lows of ₹4,641 and ₹4,663.8 before recovering. If you had treated ₹4,640 as a hard floor, you’d have seen three closes below it (28 February to 4 March 2025) and an intraday low about 3% under it, plus two more brief intraday dips below it on 17 March and 7 April — before it held again.
That is what these levels are actually like. Approximately reliable, occasionally violated, and never precise.
Doing it in Python
Finding swing points mechanically, rather than by eye:
import pandas as pd

df = pd.read_csv("britannia-ohlcv-2024-04-to-2026-03.csv",
                 parse_dates=["date"]).set_index("date")

w = 10  # a swing high is the highest high within 10 bars either side
swing_highs = df.high[df.high == df.high.rolling(2*w+1, center=True).max()]
swing_lows  = df.low[df.low  == df.low.rolling(2*w+1, center=True).min()]

# cluster the highs to find where they bunch up
print(swing_highs[swing_highs > 6100].round(1))
The w parameter is doing a lot of work, and it’s a choice, not a fact.
Set it to 5 and you get many small swings; set it to 30 and you get only the
major turns. There’s no correct value — which is itself worth knowing about
every “objective” level you’ll ever be shown.
Common mistakes
- Drawing lines to the paisa. A level is an area. Precision here is false precision, and it will make you call a zone “broken” over a rounding error.
- Finding levels by staring until one appears. With enough candles and enough willingness, a line can be drawn to touch almost anything. Count the touches, and count the times price sailed straight through the same level and you ignored it.
- Forgetting round numbers. ₹5,000 and ₹6,000 attract orders for no reason beyond humans liking round numbers. That’s not sophisticated, and it is real.
- Assuming a level holds because it held before. Every level that ever broke had held before it broke. Prior success is what a level is; it isn’t evidence about the next test.
- Ignoring why the level might exist. Sometimes there’s a fundamental reason a stock stalls at a price — a valuation multiple the market won’t pay past. The chart shows the stalling; it can’t tell you the reason.
Takeaway: Support and resistance are price areas where buying or selling has repeatedly shown up, and they work because market participants remember what they paid. Treat them as zones several percent wide rather than precise lines, judge them by how many times and over how long they’ve been tested, and expect them to break eventually — because every one of them eventually does.
This post is for educational purposes only and is not investment advice. Wealth Primer explains concepts, not recommendations — nothing here is a suggestion to buy, sell, or hold any specific security or fund. The author is not a SEBI-registered Research Analyst or Investment Adviser. Any prices or figures used as worked examples are historical and shown only to illustrate a calculation. Past performance does not indicate future results. Please do your own research or consult a registered adviser before making investment decisions. See the privacy & disclaimer policy for more.