
Technical Analysis — Zero to Hero · Part 4 of 22
Trend lines: drawing a trend, and knowing when it broke
Trends are structure, not vibes
“The stock is in an uptrend” gets said as though it were a mood. It isn’t — it has a definition, and the definition is about structure:
- An uptrend is a sequence of higher highs and higher lows.
- A downtrend is a sequence of lower highs and lower lows.
- Everything else is a range, and ranges are extremely common.
That third category matters more than most introductions admit. A stock is often not trending at all — it’s oscillating, and forcing a trend line onto a range is one of the quickest ways to fool yourself.
Where support and resistance described horizontal levels, a trend line describes a sloping one — and the logic is the same: a price area that has repeatedly mattered.
A trend line makes the structure visible: a straight line drawn through the swing lows of an uptrend, or the swing highs of a downtrend, then extended forward. It does two jobs — it describes the slope of the move so far, and it gives you something specific that can later be violated.
How to draw one
The rules are simple and the discipline is the hard part:
Uptrend line   — connect two or more swing LOWS,  extend to the right
Downtrend line — connect two or more swing HIGHS, extend to the right
Two points define a line. The third touch is what makes it interesting, because that’s the first time the line predicted something and was right.
Three rules that keep the exercise honest:
- A straight line, not a curve or a dog-leg. If you need a bend to make it fit, it isn’t a trend line.
- Draw it and leave it. Adjusting the line every time price misbehaves is drawing a picture of the past, not a test of anything.
- Decide in advance what “broken” means. A single intraday poke through, or a daily close beyond it? Both are defensible. Choosing afterwards is not.
🧒 Explain it like I'm 10 (optional — skip if this is already clear)
Imagine a ball rolling down a long ramp, bouncing as it goes. Each bounce comes back up a bit lower than the last.
If you laid a ruler along the tops of those bounces, you’d have a straight line sloping down. And you could slide the ruler forward and guess roughly how high the next bounce will get.
That’s a trend line. The interesting moment is when a bounce goes right past your ruler — because it means something changed about the ramp.
Two real trend lines
Both of these come from the same Britannia data, drawn by connecting exactly two swing points and extending. No adjusting, no curves.
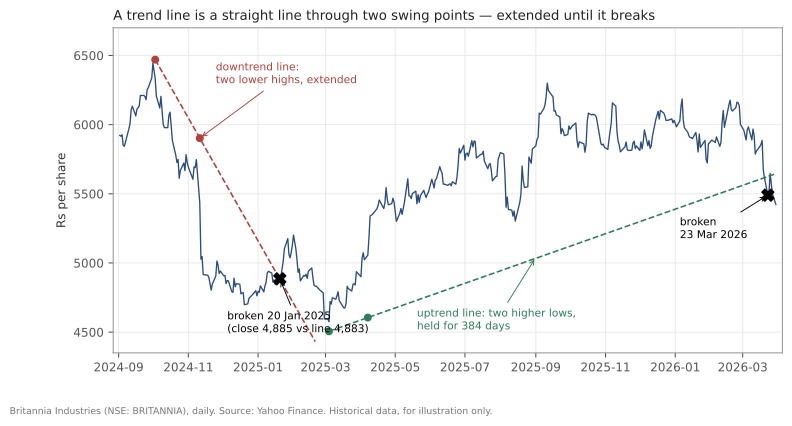
Britannia (NSE: BRITANNIA), daily, September 2024 to March 2026. Source: Yahoo Finance. Historical data, for illustration only.
The downtrend line. Connect the 3 October 2024 high of ₹6,469.9 to the 11 November 2024 high of ₹5,902.1 and extend. That line describes a fall of about ₹14.6 a day.
It broke on 20 January 2025, when the stock closed at ₹4,885.4 against a line sitting at ₹4,883.0. A margin of ₹2.4 — which tells you something important about how unclean these signals are in practice. On the day, that break would have looked like nothing at all.
The uptrend line. Connect the 4 March 2025 low of ₹4,506 to the 7 April 2025 low of ₹4,605.1 and extend. That line rises about ₹2.9 a day.
It then held — every dip through the rest of 2025 found support at or above it — for 384 days counted from the first anchor, or 350 from the second, the day the line could first be drawn, before finally breaking on 23 March 2026, right at the end of this dataset.
What the two lines actually teach
Put side by side, they make a point no textbook diagram does.
The downtrend line broke by ₹2.40 on a single close. If your rule was “a daily close beyond the line,” you had a signal. If your rule was “two consecutive closes,” or “a close 1% beyond,” you didn’t — not that day. Same chart, same line, different answer, entirely because of a threshold you chose before you started. Or worse, after.
The uptrend line is the opposite story: it did real work for nearly a year, and a line that survives 350 days and multiple tests is describing something genuine about who was buying the dips.
Both are true at once. Trend lines are neither useless nor precise. They’re approximate descriptions that occasionally give you a clean answer and frequently give you a judgement call.
Doing it in Python
Two points, a slope, and an extension — that’s all a trend line is:
import pandas as pd

df = pd.read_csv("britannia-ohlcv-2024-04-to-2026-03.csv",
                 parse_dates=["date"]).set_index("date")

def trendline(d1, v1, d2, v2):
    t1, t2 = pd.Timestamp(d1), pd.Timestamp(d2)
    slope = (v2 - v1) / (t2 - t1).days          # rupees per calendar day
    return lambda when: v1 + slope * (pd.Timestamp(when) - t1).days

up = trendline("2025-03-04", 4506.0, "2025-04-07", 4605.1)

after = df.loc["2025-04-08":]
broken = after[after.close < [up(d) for d in after.index]]
print("first close below the line:", broken.index[0].date())
Note what the code forces you to do: state the break rule explicitly
(close < line). The ambiguity doesn’t disappear in code — it just becomes
impossible to hide from.
Common mistakes
- Redrawing the line when price breaks it. The single most common self-deception in technical analysis. A line you keep adjusting can never be wrong, which means it can never tell you anything.
- Using two points and calling it confirmed. Any two points make a line. The third touch is the first real evidence.
- Forcing a trend line onto a range. If price is oscillating sideways, the trend line you draw will look convincing and mean nothing.
- Not defining “broken” in advance. As the ₹2.40 break above shows, the threshold decides the signal. Pick it first.
- Drawing on a linear scale for long periods. Over multiple years a constant percentage trend curves upward on a linear axis. For long horizons, a log scale is the more honest picture.
- Assuming a break means reversal. A broken uptrend line means the previous rate of ascent stopped. That could be a reversal — or a pause, or a slower uptrend.
Takeaway: A trend line is a straight line through two swing points, extended forward, and its value is that it can be violated — an uptrend is higher highs and higher lows, not a feeling. Draw it once, define what “broken” means before you need the answer, and remember that a line breaking by ₹2.40 on one close is technically a signal and practically a coin toss.
This post is for educational purposes only and is not investment advice. Wealth Primer explains concepts, not recommendations — nothing here is a suggestion to buy, sell, or hold any specific security or fund. The author is not a SEBI-registered Research Analyst or Investment Adviser. Any prices or figures used as worked examples are historical and shown only to illustrate a calculation. Past performance does not indicate future results. Please do your own research or consult a registered adviser before making investment decisions. See the privacy & disclaimer policy for more.