
Technical Analysis — Zero to Hero · Part 5 of 22
Moving averages: smoothing the noise, at a price
Averaging away the wiggle
A daily chart is noisy. Individual sessions jump around for reasons that have nothing to do with anything durable — a large order, a quiet holiday week, someone rebalancing a fund. Underneath that noise there may be a direction, and a moving average is the simplest tool for seeing it.
Where a trend line is a straight edge you draw by hand through two chosen points, a moving average is computed from every price in its window — no choices about which points count.
The idea is exactly what it sounds like. Take the last N closing prices, average them, plot the result. Tomorrow, drop the oldest price, add the newest, average again. The line that traces out is smoother than the price, and the larger N is, the smoother it gets.
The formulas
Two versions are in common use.
Simple Moving Average (SMA)
    SMA(N) = (P₁ + P₂ + ... + Pₙ) / N          every price weighted equally

Exponential Moving Average (EMA)
    EMA_today = (Price_today × k) + (EMA_yesterday × (1 − k))
    where k = 2 / (N + 1)                       recent prices weighted more
The difference matters in one respect: an EMA reacts faster to a sudden move, because recent prices count for more. An SMA treats a price from 200 days ago exactly as heavily as yesterday’s, right up until it drops out of the window entirely — which produces its own small artefacts.
Neither is better. Faster response means faster reaction to real changes and faster reaction to noise. That trade-off is the whole subject of this post, and it never goes away.
🧒 Explain it like I'm 10 (optional — skip if this is already clear)
Imagine tracking your test scores. One bad day doesn’t mean you’ve got worse at maths — maybe you were tired.
So instead of looking at each score, you take your last five and average them. That number moves around much less, and when it does move, it usually means something real changed.
Take the last fifty tests instead and the line gets very smooth — but it’ll be slow to notice you’ve genuinely improved, because forty-nine old scores are still dragging it down.
Smoother means steadier, but later. You can’t have both.
The lag, stated plainly
A moving average is always looking backwards. That isn’t a flaw to be engineered around — it’s what the tool is. A 200-day average is, roughly, telling you about the middle of the last 200 days. By construction, it cannot tell you about today.
So a moving average turning up is not a prediction. It’s a confirmation that something already happened, delivered some weeks after it happened. The faster you make it, the sooner it tells you — and the more often it tells you about things that turned out to be nothing.
The chart
Britannia with the two most-watched averages, the 50-day and the 200-day:
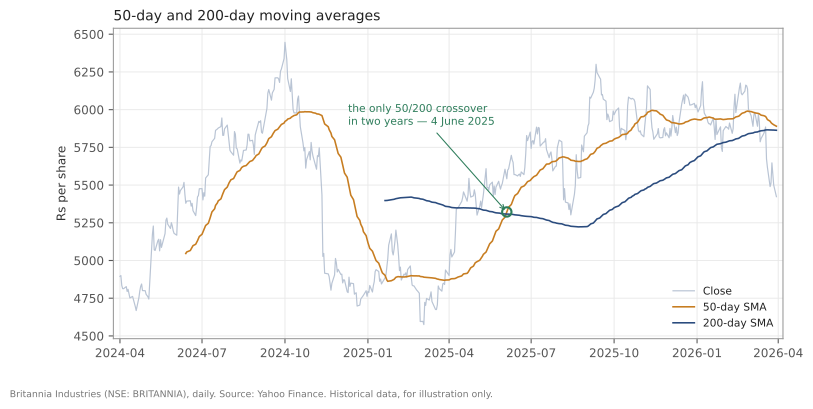
Britannia (NSE: BRITANNIA), daily bars, 1 April 2024 to 30 March 2026. Source: Yahoo Finance. Historical data, for illustration only.
Notice the 200-day line doesn’t start until January 2025. It can’t — it needs 200 bars of history before it has anything to average. Every indicator has this warmup problem, and quoting a value from inside the warmup window is a real and common error.
The golden cross, and why one instance proves nothing
When a shorter average crosses above a longer one, it’s called a golden cross; the reverse is a death cross. These get an enormous amount of attention, including in the financial press.
Here is what two full years of Britannia data contains:
| Golden crosses (50 above 200) | 1 |
| Death crosses (50 below 200) | 0 observed |
One. In two years. And the zero needs an asterisk: when the 200-day first existed, on 20 January 2025, the 50-day was already below it. So if there was a death cross, it happened during the warmup, where this data can’t see it.
That single golden cross, on 4 June 2025:
| Close on the day | ₹5,542 |
| 50-day SMA | ₹5,321.8 |
| 200-day SMA | ₹5,307.6 |
| Close three months later | ₹6,083 |
| Close at the end of the dataset | ₹5,423 |
Read that sequence honestly. Price rose about 10% over the following three months, which looks like a success. Then it gave all of it back and more, finishing the dataset below where the cross occurred.
So: did the golden cross work? Over three months, yes. Over the ten months to the end of the dataset, no. The answer depends entirely on a holding period nobody specified in advance.
And more importantly — this is one instance. You cannot learn anything about whether golden crosses work from a single occurrence, in the same way you cannot learn whether a coin is fair from one flip. Any article showing you a golden cross that preceded a rally is showing you one flip. The honest version of this question needs thousands of crossovers across many stocks and decades. When researchers have done that work, the results are much less exciting than the name suggests. Brock, Lakonishok and LeBaron (1992) found simple moving-average rules had some predictive power over a century of Dow Jones data — but Sullivan, Timmermann and White (1999) found that edge didn’t hold up in the decade after the original sample, and Park and Irwin’s 2007 survey of the literature (Journal of Economic Surveys) concluded that many positive results were weakened by data snooping and understated trading costs.
Which N should you use?
The popular values — 20, 50, 100, 200 — are conventions, not discoveries. They’re round numbers that roughly correspond to a month, a quarter, half a year and a year of trading days. Their significance is partly self-fulfilling: enough people watch the 200-day that its being watched has some effect.
Be suspicious of anyone claiming to have found the optimal setting. Search enough parameters against past data and something will look brilliant purely by chance — a problem called overfitting, which the final post in this series treats properly.
Doing it in Python
import pandas as pd

df = pd.read_csv("britannia-ohlcv-2024-04-to-2026-03.csv",
                 parse_dates=["date"]).set_index("date")

df["sma50"]  = df.close.rolling(50).mean()
df["sma200"] = df.close.rolling(200).mean()
df["ema50"]  = df.close.ewm(span=50, adjust=False).mean()

# a crossover is a change of sign in (short - long)
above = (df.sma50 > df.sma200).astype(int)
crosses = above.diff()
print(df.index[crosses == 1].date)    # golden crosses
print(df.index[crosses == -1].date)   # death crosses
The .rolling(200) call returns NaN until it has 200 observations — pandas
handling the warmup problem for you, which is a good reason to use it rather
than rolling your own.
Common mistakes
- Expecting a moving average to lead. It is arithmetically incapable of it. It is a smoothed record of the past.
- Quoting values from the warmup window. A 200-day average computed on 180 days of data is not a 200-day average.
- Judging a crossover rule on one instance. As above — one flip.
- Optimising the lookback period against past data. The best-performing N on data you already have is mostly a description of that data’s noise.
- Assuming price “should” return to its average. Sometimes it does, sometimes a stock stays above its 200-day for years. There’s no restoring force here, just arithmetic.
- Using the same settings on wildly different instruments. A 50-day average on a stable large-cap and on a volatile small-cap are doing very different jobs.
Takeaway: A moving average smooths price into something you can read a direction from, at the unavoidable cost of lag — smoother always means later. The crossover signals built on them are worth understanding, but two years of Britannia data contains exactly one golden cross and no observable death cross, which is a useful reminder that a single chart can never tell you whether a rule works.
This post is for educational purposes only and is not investment advice. Wealth Primer explains concepts, not recommendations — nothing here is a suggestion to buy, sell, or hold any specific security or fund. The author is not a SEBI-registered Research Analyst or Investment Adviser. Any prices or figures used as worked examples are historical and shown only to illustrate a calculation. Past performance does not indicate future results. Please do your own research or consult a registered adviser before making investment decisions. See the privacy & disclaimer policy for more.