
Mutual Funds, Minus the Marketing · Part 5 of 23
Drawdown: not just how far it fell, but how long you waited
The number that describes the experience
Returns describe the destination. Drawdown describes the journey, and the journey is what people actually quit during.
A drawdown is the fall from a previous peak:
                Current NAV
Drawdown = ─────────────────────  − 1
            Highest NAV so far
Track it every day and you get an underwater chart — a picture that sits at zero whenever the fund is at an all-time high and dips below whenever it isn’t. The maximum drawdown is the worst point on it.
Two things make this more useful than volatility for most people. It’s in units anyone understands (“down 38%” rather than “annualised standard deviation of 21%”). And it corresponds to a real decision: the moment you open your statement, see a number well below what you put in, and have to decide whether to hold.
🧒 Explain it like I'm 10 (optional — skip if this is already clear)
Imagine you’re tracking the highest score you’ve ever got in a game.
Drawdown is how far below your best score you are right now. If you just set a record, it’s zero. If your record is 100 and you’re scoring 40, you’re “down 60%.”
The interesting question isn’t only how far you dropped. It’s how many games it took to beat your record again. Dropping to 40 and recovering next week is annoying. Dropping to 40 and taking six years to get back to 100 is a completely different experience — even though the drop was identical.
Twenty years underwater
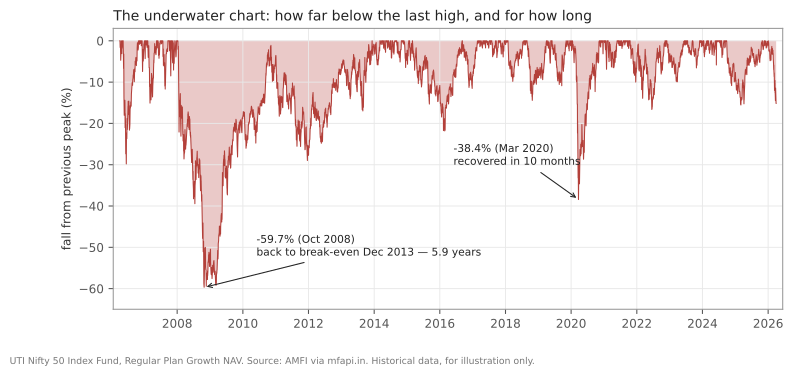
UTI Nifty 50 Index Fund, Regular Plan - Growth (AMFI scheme code 100822). Source: AMFI via mfapi.in. Historical data, for illustration only.
Every fall of more than 15% from a peak, with how long it took to get back:
| Peak | Trough | Fall | Back to break-even | Peak-to-peak |
|---|---|---|---|---|
| 2008-01-08 | 2008-10-27 | −59.7% | 2013-12-09 | 2,162 days |
| 2020-01-14 | 2020-03-23 | −38.4% | 2020-11-09 | 300 days |
| 2006-05-10 | 2006-06-14 | −29.8% | 2006-10-30 | 173 days |
| 2015-03-03 | 2016-02-25 | −21.8% | 2016-09-06 | 553 days |
| 2021-10-18 | 2022-06-17 | −16.6% | 2022-11-11 | 389 days |
| 2024-09-26 | 2025-03-04 | −15.5% | 2025-10-27 | 396 days |
| 2026-01-02 | 2026-03-31* | −15.1% | Not yet recovered as of 2026-03-31 | — |
| 2007-02-07 | 2007-03-05 | −15.1% | 2007-05-17 | 99 days |
* The January 2026 row is still open. The data ends on 31 March 2026, with the fund still more than 15% below its January 2026 high, so the “trough” there is just the last NAV we have. It could fall further or recover; this table can’t tell you which.
The worst was a fall of 59.7%, on 27 October 2008.
The column that matters most
Compare the top two rows, because together they make the point of this entire post.
2008: fell 59.7%, and took 2,162 days — five years and eleven months — to get back to break-even. Someone who invested at the January 2008 peak saw no gain at all until December 2013.
2020: fell 38.4%, and recovered in 300 days. Less than ten months.
Both were crashes. Both were frightening at the time. But one asked you to hold through six years of your investment being worth less than you paid, and the other asked for ten months. Those are not remotely the same experience, and no single “maximum drawdown” statistic distinguishes them.
This is why recovery time belongs beside depth. A factsheet quoting “maximum drawdown: 59.7%” tells you less than half the story.
What this means for goals
The practical consequence is about when you need the money.
If your horizon is three years and a 2008-style episode arrives in year one, you may reach your deadline still underwater — the recovery took nearly six. That isn’t a hypothetical: it’s what the first row of that table describes.
It’s also the honest version of the point the rolling returns post made. Three-year windows were negative 2.9% of the time; seven-year windows never were. Drawdown recovery is the mechanism behind those statistics — the reason short horizons are risky isn’t that returns are lower, it’s that you might be forced to sell during a recovery that hasn’t finished.
Drawdown and behaviour
Worth being blunt: the largest cost of a drawdown is usually not the drawdown. It’s selling during one.
An investor who bought at the January 2008 peak and held through October 2008 was whole by December 2013 and far ahead by 2026. An investor who sold at the bottom converted a temporary decline into a permanent loss, and typically returned to equities only after the recovery was well advanced.
Which is why knowing these numbers in advance matters. “This asset has fallen 60% before and taken six years to recover” is information you want before you invest, not a discovery you make in month four.
Doing it in Python
import pandas as pd

nav = pd.read_csv("uti-nifty50-index-fund-nav.csv",
                  parse_dates=["date"]).set_index("date")
r = nav.nav_regular_growth.dropna()

running_peak = r.cummax()
drawdown = (r / running_peak - 1) * 100

print(f"max drawdown {drawdown.min():.1f}% on {drawdown.idxmin().date()}")

# how long from the pre-crash peak back to break-even
peak_date = r.loc[:drawdown.idxmin()].idxmax()
recovered = r.loc[drawdown.idxmin():]
recovered = recovered[recovered >= r[peak_date]]
print(f"peak {peak_date.date()} -> recovered {recovered.index[0].date()} "
      f"({(recovered.index[0] - peak_date).days} days)")
cummax() is the whole trick — the running maximum is the “highest so far,”
so dividing by it gives the distance below the previous high at every point.
Common mistakes
- Quoting depth without recovery time. 59.7% over six years and 38.4% over ten months are different risks. Only one number distinguishes them.
- Assuming past maximum drawdown is a floor. 59.7% is what happened in this window, not a limit. Worse has happened in other markets.
- Measuring drawdown on monthly data. Month-end NAVs miss intra-month troughs and understate the fall. Use daily data.
- Thinking a diversified fund avoids this. This is a diversified fund — fifty large companies across sectors. It still fell 60%.
- Confusing drawdown with volatility. Volatility is how much it wobbles in both directions; drawdown is the depth of actual falls. The next post covers the difference.
- Judging your risk tolerance from a rising market. Nearly everyone believes they can hold through a 60% fall until they are in one.
Takeaway: Drawdown measures how far a fund sits below its previous high, and it describes the experience of owning it far better than any return figure. This index fund fell 59.7% in 2008 and needed almost six years to recover, then fell 38.4% in 2020 and recovered in ten months — same asset, same kind of event, and the wait is the part that decides whether you were still holding at the end.
This post is for educational purposes only and is not investment advice. Wealth Primer explains concepts, not recommendations — nothing here is a suggestion to buy, sell, or hold any specific security or fund. The author is not a SEBI-registered Research Analyst or Investment Adviser. Any prices or figures used as worked examples are historical and shown only to illustrate a calculation. Past performance does not indicate future results. Please do your own research or consult a registered adviser before making investment decisions. See the privacy & disclaimer policy for more.