
Mutual Funds, Minus the Marketing · Part 10 of 30
Debt funds explained: accrual, mark-to-market, and why a gilt fund can fall
Two ways a debt fund makes money
The first nine posts in this series used an equity index fund for every calculation. A debt fund holds bonds instead of shares — government securities, treasury bills, bank certificates of deposit, corporate bonds — and it earns in two quite different ways at once.
Accrual. A bond pays interest (the coupon). A fund holding ₹100 crore of bonds yielding 7% is owed roughly ₹1.9 lakh of interest every single day, whether or not anyone is watching. That income is added to the fund’s assets daily, which is why a debt fund’s NAV tends to creep upward in a nearly straight line.
Mark-to-market. The fund also has to value every bond it holds at what the bond would fetch today. Bond prices move inversely to interest rates: when market yields rise, the fixed coupon on an existing bond looks less attractive, so its price falls. That revaluation hits the NAV the same day.
Which of the two dominates depends on one number — how far away the bonds’ cash flows are, which the modified duration post covers. A fund holding paper that matures tomorrow has almost nothing to reprice; a fund holding 15-year government bonds has a great deal.
Daily NAV change ≈ Accrual (YTM ÷ 365) − Modified duration × Change in yield
YTM is the yield to maturity — the annual return the fund’s bonds lock in if held to maturity. The first term is steady and positive. The second is noisy and can be large in either direction. Every debt fund is a mix of the two, and the SEBI category tells you roughly what mix.
🧒 Explain it like I'm 10 (optional — skip if this is already clear)
Imagine you lent your friend ₹100 and they promised to pay you ₹7 a year for ten years, then the ₹100 back. Every day, you’re a little richer — about 2 paise — because interest is building up. That’s accrual.
Now imagine a new friend shows up offering ₹9 a year on the same deal. Suddenly nobody wants to buy your ₹7-a-year loan off you for ₹100; they’d only pay maybe ₹90. You still get your ₹7 a year, but today your loan is worth less. That’s mark-to-market.
If your loan ended tomorrow, nobody would care about the ₹9 offer — you’re about to get your ₹100 back anyway. The longer the loan, the more the new offer hurts. That’s duration.
Three funds, one fund house, very different behaviour
To see the two forces separately, here are three debt funds from the same fund house, chosen because they sit at very different points on the duration scale. Nothing here is about which is better; they are built to do different jobs.
| Fund | What it holds | Typical duration |
|---|---|---|
| UTI Overnight Fund | Paper maturing the next business day | 1 day |
| UTI Money Market Fund | Money-market instruments up to a year | A few months |
| UTI Gilt Fund | Government securities, often long-dated | Several years |
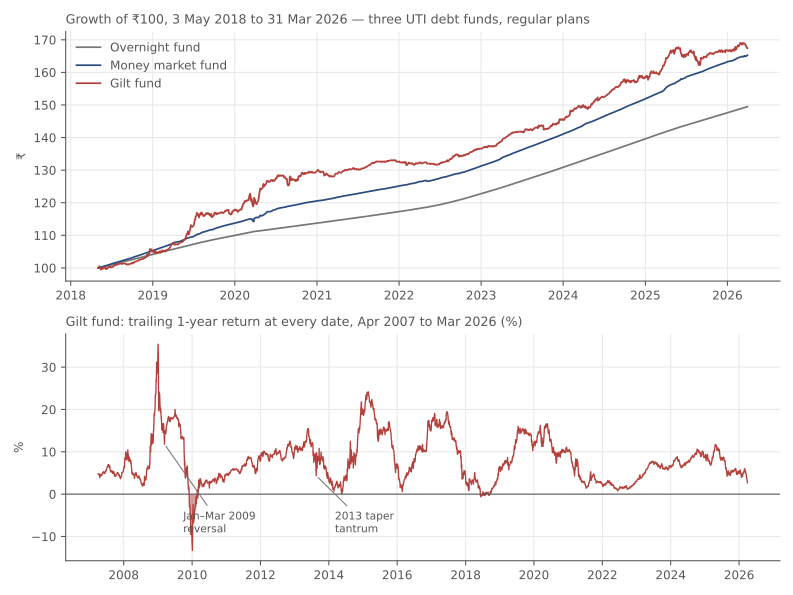
Regular plans, 3 May 2018 to 31 March 2026 (7.9 years). Source: AMFI NAV history via mfapi.in (api.mfapi.in/mf/ followed by the scheme code), scheme codes 100814, 112077 and 102510. Historical NAV data, for illustration only.
| Item | UTI Overnight Fund | UTI Money Market Fund | UTI Gilt Fund |
|---|---|---|---|
| Annualised return | 5.21% | 6.56% | 6.73% |
| Annualised volatility | 0.12% | 0.48% | 2.87% |
| Days with a negative NAV change | 0.0% | 4.4% | 40.2% |
| Worst single day | 0.0% | −0.31% | −1.29% |
| Worst fall from a peak | 0.0% | −0.76% | −3.3% |
| Worst 1-year return | 2.95% | 3.61% | 0.78% |
| Best 1-year return | 6.81% | 8.72% | 16.64% |
Read the columns left to right. The overnight fund had no down days at all in nearly eight years — pure accrual, nothing to reprice. The money market fund had a few dozen (84 of 1,914 days — about one day in 23), the worst being a 0.31% drop in the March 2020 panic, and it was back at its high within 16 days. The gilt fund fell on 40.2% of days — roughly two in five — because it is mostly a mark-to-market instrument wearing a debt fund’s label.
Notice the returns, too. The gilt fund’s extra 1.52 percentage points a year over the overnight fund came with roughly 24 times the volatility. That is the trade the Sharpe ratio post taught you to look for — extra return is not free, and the price is paid in days like the ones below.
When rates move, the long end moves most
The same three funds through five interest-rate episodes. A blank cell means the fund did not yet carry its present mandate for that window (the overnight scheme became an overnight fund around May 2018, during SEBI’s recategorisation — that’s where its NAV series changes character — and its earlier history reflects a different portfolio).
| Episode | Window | Overnight | Money market | Gilt |
|---|---|---|---|---|
| 2008 gilt rally into the January 2009 reversal | 2008-10-01 to 2009-01-31 | — | — | 18.73% |
| 2013 taper tantrum (RBI liquidity squeeze) | 2013-05-15 to 2013-08-20 | — | 2.09% | −5.91% |
| 2020 COVID rate cuts | 2020-02-01 to 2020-07-31 | 1.69% | 3.73% | 8.85% |
| 2022 rate-hike cycle, first half | 2022-01-01 to 2022-06-30 | 1.81% | 1.9% | −0.54% |
| 2024-25 easing | 2024-04-01 to 2025-03-31 | 6.57% | 7.78% | 8.76% |
Two of those rows are the whole lesson.
2013. When the RBI squeezed liquidity in July 2013 to defend the rupee, short-term yields spiked and long-bond prices fell. The gilt fund lost 5.91% between mid-May and late August, while the money market fund quietly earned 2.09% over the same fourteen weeks. Same rate shock, opposite sign — because one fund had almost nothing to reprice and the other had years of it.
2008–09. The other direction. As the RBI slashed rates after the Lehman collapse, the gilt fund gained 31.63% between 1 October 2008 and its peak on 2 January 2009 — an equity-sized return from a government-bond fund — and then gave back 9.8% within the month, including a 6.19% fall in a single day, on 7 January 2009.
Over its full 20-year history the gilt fund’s worst fall from a peak was 16.05% (peak 2 January 2009, trough 12 March 2009), and it took 1125 days — over three years — to get back to that high. Its worst one-year return was −13.29%; its best was 35.43%. Those are not numbers most people associate with “debt”.
Credit risk: the third thing, which this data doesn’t show
Everything above is interest-rate risk, on funds holding government or top-rated paper. There is a separate risk the NAV history of these three funds cannot illustrate: the borrower not paying.
A fund holding lower-rated corporate bonds earns a higher yield precisely because some of those borrowers might default. When one does, the fund writes the bond down — sometimes to zero, sometimes overnight. Indian debt-fund investors saw this in 2018–2020 across several fund houses. The lesson is structural, not about any one fund: a debt fund’s yield above a government bond of the same maturity is the market’s price for credit risk, and that risk tends to arrive all at once rather than a little each day.
The categories post explains how SEBI’s category labels signal both risks — duration by name, credit by portfolio rules.
Doing it in Python
The accrual-versus-repricing split is visible in the data with two lines: the fraction of down days, and the size of the worst one.
import pandas as pd

funds = {
    "overnight": "uti-overnight-fund-nav.csv",
    "money_market": "uti-money-market-fund-nav.csv",
    "gilt": "uti-gilt-fund-nav.csv",
}
for name, path in funds.items():
    nav = pd.read_csv(path, parse_dates=["date"]).set_index("date")
    r = nav.nav_regular_growth.loc["2018-05-03":].pct_change().dropna()
    print(f"{name:13s} down days {100*(r<0).mean():5.1f}%   "
          f"worst day {100*r.min():6.2f}%   "
          f"ann. vol {100*r.std()*252**0.5:5.2f}%")
One warning: two of these CSVs carry a face-value change (the NAV jumps ×100
on a single day when the unit face value moved from ₹10 to ₹1,000). A
pct_change() across that day reads as a return of roughly 9,900%. Check for
impossible one-day moves before computing anything — the
data & methodology page describes how
the series used here were spliced.
Common mistakes
- Reading “debt” as “safe”. The gilt fund holds the safest borrower in India and still fell 16.05% and needed three years to recover. Safe from default is not the same as safe from repricing.
- Choosing a debt fund by last year’s return. A gilt fund’s best years are the ones just after rates fell. The category that topped a one-year table usually did so because of the move that has now already happened.
- Matching the wrong duration to the goal. Money needed in six months does not belong in a fund whose NAV can fall 8% in a quarter. The duration of the fund and the horizon of the goal should roughly agree.
- Ignoring credit risk because the NAV looks smooth. Accrual funds holding lower-rated paper look like the overnight fund’s line above — right up to the day a borrower defaults.
- Forgetting tax. As at the date above, gains on “specified” debt-fund units bought on or after 1 April 2023 are generally taxed at your slab rate whatever the holding period; which funds count as “specified” has changed, so check the current rule — see the tax series post on debt funds.
Sources
- RBI, Government Securities Market in India: a primer (FAQ): how government securities, which gilt funds hold, are priced.
- SEBI Master Circular for Mutual Funds (20 March 2026): SEBI’s rules on mutual fund categories and portfolios.
- AMFI, net asset value data: the NAV history the post’s figures come from.
Takeaway: A debt fund earns two ways — interest accruing daily, and bonds repricing as rates move — and duration decides which one you feel. Across eight years the overnight fund never had a down day, while the gilt fund fell on two days in five — and over its full history once lost 16% peak to trough. Same fund house, same word on the label, completely different instruments.
This post is for educational purposes only and is not investment advice. Wealth Primer explains concepts, not recommendations — nothing here is a suggestion to buy, sell, or hold any specific security or fund. The author is not a SEBI-registered Research Analyst or Investment Adviser. Any prices or figures used as worked examples are historical and shown only to illustrate a calculation. Past performance does not indicate future results. Please do your own research or consult a registered adviser before making investment decisions. See the privacy & disclaimer policy for more.
Tax rules are described as at August 2026 and may have changed since. The author is not a tax professional, and this post is not tax advice. Confirm the current position, and how it applies to you, with a qualified tax professional before you act.