
Mutual Funds, Minus the Marketing · Part 11 of 30
Index funds vs ETFs: same fifty stocks, two wrappers
The portfolio is identical. The wrapper isn’t.
An ETF — exchange-traded fund — is a mutual fund whose units are listed on a stock exchange. An index fund and an ETF tracking the Nifty 50 both hold the same fifty companies in the same proportions. If you looked only at what’s inside, you couldn’t tell them apart.
The difference is entirely in how you get in and out:
| Item | Index fund | ETF |
|---|---|---|
| Where you buy | From the fund house (directly or via a platform) | On the NSE/BSE, from another investor, like a share |
| Price you pay | That day’s NAV, whatever it turns out to be | The market price at the moment you trade |
| Minimum | Often ₹100–₹500 | One unit (a few hundred rupees for a Nifty ETF) |
| Account needed | Folio with the fund house | Demat + trading account |
| Costs | Expense ratio only | Expense ratio (usually lower) plus brokerage, bid-ask spread, demat charges |
| SIP | Native | Only if your broker builds one for you |
| Dividends | Growth plan reinvests automatically | Some ETFs pay out occasionally (this one did once, in February 2021); you get cash, with no growth-plan option to reinvest |
The first post in this series explained that NAV is what one unit’s share of the portfolio is worth. For an index fund, that is your price. For an ETF, NAV is what the unit is worth — but the price is whatever the last buyer and seller agreed on, which can sit above or below it.
🧒 Explain it like I'm 10 (optional — skip if this is already clear)
Imagine a big jar of fifty different sweets, and two ways to own a scoop of it.
Way one: you give the jar’s owner your money at the end of the day, and they hand you exactly what a scoop is worth at closing time. No haggling.
Way two: the scoops are printed as tokens, and people trade the tokens with each other all day in the playground. Most of the time a token sells for about what a scoop is worth. But if lots of kids suddenly want tokens and nobody’s selling, you might pay more than a scoop is worth. If nobody wants them, you might sell for less. The sweets in the jar didn’t change. The price of the token did.
iNAV: the number that keeps the price honest
Because an ETF trades all day while NAV is computed once at the close, the exchange publishes an iNAV — indicative NAV — through the trading day (for equity ETFs, SEBI’s May 2022 circular on passive funds requires it to lag the market by no more than 15 seconds), computed from the live prices of the fifty underlying stocks. It’s what a unit is worth right now.
Premium / discount = (Market price − iNAV) / iNAV
For a large, liquid Nifty 50 ETF this is usually a few basis points either way. Large institutions called authorised participants keep it there: if the price drifts above iNAV, they create new units from the underlying shares and sell them; if it drifts below, they buy units and redeem them for the shares. The arbitrage is what tethers price to value.
The tether can fray. Thin ETFs — small ones, or ones tracking less liquid indices — can trade several percent away from iNAV for hours, and a market order placed in a hurry will happily fill at that price. Rule for ETF orders: look at the iNAV, and use a limit order. There is no equivalent risk in an index fund, because there is no price other than NAV.
The data: same index, three wrappers
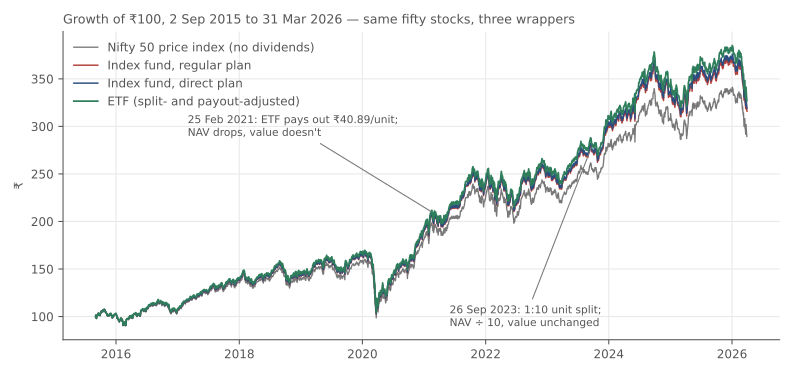
UTI runs both a Nifty 50 index fund and a Nifty 50 ETF. Here is ₹100 in each from 2 September 2015 (the ETF’s first NAV) to 31 March 2026, 10.6 years, alongside the Nifty 50 price index. Source: AMFI NAV history via mfapi.in (api.mfapi.in/mf/ followed by the scheme code), codes 135320, 100822 and 120716; index from Yahoo Finance. Historical data, for illustration only — this is about how the wrappers behave, not about either product’s merits.
| Item | Annualised return | ₹100 became |
|---|---|---|
| Nifty 50 price index (PRI) | 10.57% | ₹289.4 |
| UTI Nifty 50 Index Fund, Regular | 11.49% | ₹316.0 |
| UTI Nifty 50 Index Fund, Direct | 11.59% | ₹319.1 |
| UTI Nifty 50 ETF (split- and payout-adjusted) | 11.86% | ₹327.0 |
Two things to notice, and one big caveat.
First, all three fund lines sit above the price index, by about a percentage point a year. That is not skill — it’s dividends. The benchmarks post explained that the price index excludes the dividends the fifty companies pay, while the funds receive them. Measured against the total-return index, all three would sit slightly below it, by roughly their costs.
Second, the ordering: ETF, then direct plan, then regular plan. Year by year:
| Year | ETF − index | Direct − index | Regular − index |
|---|---|---|---|
| 2016 | 1.67 pp | 1.09 pp | 0.99 pp |
| 2017 | 1.66 pp | 1.14 pp | 1.03 pp |
| 2018 | 1.38 pp | 1.18 pp | 1.11 pp |
| 2019 | 1.43 pp | 1.31 pp | 1.23 pp |
| 2020 | 0.79 pp | 0.66 pp | 0.6 pp |
| 2021 | 1.38 pp | 1.18 pp | 1.08 pp |
| 2022 | 1.29 pp | 1.11 pp | 1.0 pp |
| 2023 | 1.28 pp | 1.01 pp | 0.86 pp |
| 2024 | 1.19 pp | 1.0 pp | 0.84 pp |
| 2025 | 1.35 pp | 1.17 pp | 1.06 pp |
| Average | 1.34 pp | 1.08 pp | 0.98 pp |
Each column is that product’s tracking difference against the price index — what its costs actually take from you — so the difference in their tracking differences is the cost difference between the wrappers. The ETF’s lower expense ratio shows up as a consistently larger dividend-plus-cost gap over the index.
The caveat: the ETF’s line is its NAV, adjusted for two events described below. It is what a unit was worth — not what you could have bought or sold one for. Brokerage, the bid-ask spread and any premium or discount to iNAV all come off the ETF’s number and none of them come off the index fund’s. No market-price series is used here, because there isn’t a reliable free one; so this comparison flatters the ETF by exactly the amount of those frictions.
Two things that happened to the ETF’s NAV, and what they teach
The raw NAV series for this ETF contains two jumps that are not market moves, and both are lessons in reading an ETF’s history.
A 1:10 unit split, 26 September 2023. The NAV went from ₹2,111.5501 to ₹211.0492 overnight. Nobody lost anything: each unit became ten, and each was worth a tenth. Fund houses do this to make one unit affordable — a ₹2,000 unit is awkward for someone investing ₹500 a month. The face value and splits post covers the same idea for shares. If you download NAV history and don’t correct for it, every return you compute across that date is wrong by a factor of ten.
A payout, 25 February 2021. The Nifty rose that day; the ETF’s NAV fell by 2.55% relative to it — from ₹1,600.4888 to ₹1,571.92 per unit — because the fund distributed roughly ₹40.89 a unit to holders. That cash landed in investors’ bank accounts, not in the NAV. An index fund’s growth plan would have reinvested it silently. So an ETF-vs-index-fund comparison on raw NAV understates the ETF by the payout; the ETF line above assumes the payout was reinvested, which is the only fair basis.
Both events are routine. Both quietly break any spreadsheet that hasn’t been told about them.
Which wrapper, then?
Not a recommendation — a checklist of which frictions apply to you:
- You invest small amounts monthly and want it automatic → the index fund’s native SIP is the path of least resistance.
- You already run a demat account, trade in larger lumps, and will use limit orders against iNAV → the ETF’s lower expense ratio can outweigh the trading costs.
- You want dividends reinvested without thinking → growth-plan index fund.
- You are buying something other than a large, liquid Nifty/Sensex ETF → check the traded volume and the premium/discount history first. Thin ETFs are where the wrapper bites.
Common mistakes
- Market orders on an ETF. You get whatever price is on the screen, which in a thin ETF can be several percent from iNAV. Limit orders, always.
- Comparing ETF NAV returns with index fund returns and calling it a verdict. NAV ignores the spread and brokerage you actually pay on the ETF.
- Not correcting for splits. A 1:10 split looks like a 90% crash in a raw NAV download.
- Forgetting an ETF may pay out. The cash arrives in your bank account and is generally taxed as dividend income in the year received — see the dividends and interest post in the Tax series. A growth-plan index fund defers all of that until you sell.
- Assuming “ETF” means “Nifty 50”. SEBI’s category rules make an index ETF hold at least 95% in its index’s securities, so the wrapper is passive — but the index can be anything from the Nifty 50 to a narrow sector or theme. Read the scheme document.
Sources
- SEBI Master Circular for Mutual Funds (20 March 2026): SEBI’s rules on index funds and ETFs, including tracking error and the indicative NAV.
- AMFI, net asset value data: the NAV data used in the comparison.
Takeaway: An index fund and an ETF on the same index own the same stocks; the difference is that one sells you units at NAV and the other lets you trade them at a price. Over ten years the ETF’s lower cost showed up as about a quarter of a percentage point a year — before the brokerage, spread and iNAV gap that only the ETF buyer pays. Choose the wrapper for the frictions that apply to you, not for the portfolio, which is identical.
This post is for educational purposes only and is not investment advice. Wealth Primer explains concepts, not recommendations — nothing here is a suggestion to buy, sell, or hold any specific security or fund. The author is not a SEBI-registered Research Analyst or Investment Adviser. Any prices or figures used as worked examples are historical and shown only to illustrate a calculation. Past performance does not indicate future results. Please do your own research or consult a registered adviser before making investment decisions. See the privacy & disclaimer policy for more.
Tax rules are described as at August 2026 and may have changed since. The author is not a tax professional, and this post is not tax advice. Confirm the current position, and how it applies to you, with a qualified tax professional before you act.