
Fundamental Analysis — Beginner to Expert · Part 19 of 37
GNPA, NNPA, provision coverage and credit cost: the loans that don't come back
The cost that arrives late
A manufacturer knows its cost of goods when it ships. A bank finds out its real cost of goods over the next several years, as it learns which loans won’t be repaid.
This is the single most important thing about reading a bank, and the reason the first post said a bank’s profit is partly a decision. Interest income arrives now. Losses arrive later, in lumps, and the bank has to estimate them in advance. The estimate is called a provision, and the loans it is estimating about are non-performing assets (NPAs).
From a missed EMI (equated monthly instalment) to a loss
When a borrower misses an EMI — the fixed monthly loan repayment — the clock starts. In India the classification is rule-based (the Reserve Bank of India’s, or RBI’s, income recognition and asset classification norms), which is what makes it comparable across banks:
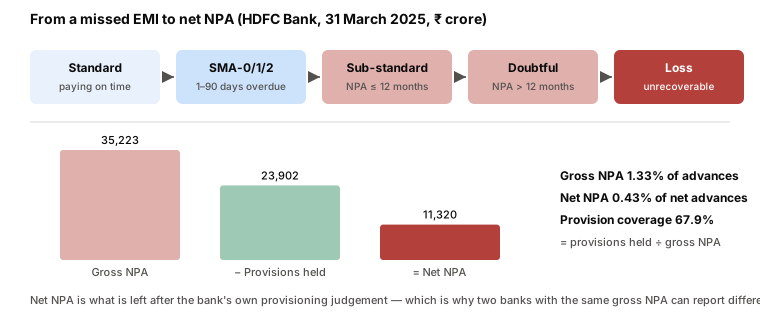
| Stage | Definition (simplified) | What the bank does |
|---|---|---|
| Standard | Paying on time | Small general provision |
| SMA-0 / 1 / 2 | Special Mention Account: 1–30, 31–60, 61–90 days overdue | Watch list; for exposures of ₹5 crore and above, reported to the RBI’s CRILC (Central Repository of Information on Large Credits) |
| Sub-standard | Over 90 days overdue — the loan is now an NPA | Stop recognising interest income; provide a percentage of the balance |
| Doubtful | NPA for more than 12 months | Higher provision, rising with age and depending on security |
| Loss | Identified as unrecoverable | Provide 100% |
| Written off | Removed from the books | Any later recovery is income |
Two things happen at the 90-day line. The bank stops counting interest on that loan as income (so NII falls), and it must set money aside. Both hit the P&L, which is why the moment of classification matters and why banks watch the SMA-2 bucket — the loans one month from tipping over.
GNPA vs NNPA: gross, net, and the number in between
Gross NPA (GNPA)  =  Total loans classified as non-performing
Net NPA (NNPA)    =  Gross NPA  −  Provisions held against those NPAs

GNPA %  =  Gross NPA  /  Gross advances
NNPA %  =  Net NPA    /  Net advances

Provision coverage ratio (PCR)  =  Provisions held  /  Gross NPA
Gross NPA is what has gone wrong. Net NPA is what has gone wrong that the bank has not yet set money aside for — the part still exposed to shareholders. Provision coverage is the bridge between them.
| Item | Gross NPA (GNPA) | Net NPA (NNPA) |
|---|---|---|
| What it counts | Every loan classified as non-performing | The part of those loans not yet covered by provisions |
| The % is taken on | Gross advances | Net advances (after provisions) |
| What moves it | Loans turning bad, recoveries, upgrades, write-offs | All of those, plus how much the bank chooses to provide |
| What it answers | How much of the loan book has gone wrong? | How much of that is still exposed to shareholders? |
Two banks with the same GNPA can report very different NNPA, because provisioning is partly a choice (more on that below). Read the two together, with the coverage ratio, rather than either one alone.
Worked example: HDFC Bank, FY25
From HDFC Bank’s results for the year ended 31 March 2025 (standalone, audited). ₹ crore, historical, for illustration only.
| Item | 31 Mar 2024 | 31 Mar 2025 |
|---|---|---|
| Gross NPA | 31,173.32 | 35,222.64 |
| GNPA % of gross advances (reported) | 1.24% | 1.33% |
| Net NPA | 8,091.74 | 11,320.43 |
| NNPA % of net advances (reported) | 0.33% | 0.43% |
| Provisions held against NPAs (GNPA − NNPA) | 23,081.58 | 23,902.21 |
| Provision coverage ratio | 74.0% | 67.9% |
So on 31 March 2025, of every ₹100 of loans about ₹1.33 was non-performing; the bank had set aside about ₹0.9 of that, leaving ₹0.43 still exposed. (The filing also notes GNPA excluding agricultural loans was 1.13% — farm lending has a seasonal NPA pattern that banks often show separately.)
Notice that coverage computed this way is specific provisions against NPAs. Banks also hold general and floating provisions not tied to any particular loan; some report a “PCR including write-offs” or including those buffers, which comes out higher. Same warning as with NIM: check which definition a number uses before comparing it.
Credit cost: the P&L view
GNPA and NNPA are balance-sheet snapshots — the stock of bad loans. Credit cost is the flow: how much the year’s provisions ate, relative to the loan book.
Credit cost = Provisions for bad loans in the year / Average advances
| Item | ₹ crore |
|---|---|
| Provision for non-performing assets, FY25 | 12,715.31 |
| Average advances (FY24–FY25) | 25,52,235.06 |
| Credit cost | 0.5% |
Set this against the spread of about 3.41 percentage points and the arithmetic of lending becomes visible: the bank earns roughly three-and-a-half rupees per hundred lent, and loses about half a rupee of it to loans that fail. In a bad year for credit, credit cost can run several times higher — and at a few percent it consumes most of the spread. That is what a “credit cycle” means in rupees.
Why net NPA is partly a choice
Look again at the total provisions line from the first post:
| Item | FY24 | FY25 |
|---|---|---|
| Provisions and contingencies (total) | 23,492.14 | 11,649.42 |
| of which floating provision | 10,900 | Nil |
In FY24 the bank chose to make a ₹10,900 crore floating provision — money set aside against no specific loan, as a buffer for the future. RBI rules allow it; nothing forced it. In FY25 it made none. Strip that choice out and the two years’ provisioning look far more similar than the headline halving suggests.
This is the honest complication with every NPA number. Gross NPA is largely rule-driven — 90 days is 90 days. But how much to provide against a doubtful loan (within RBI minimums), whether to write a loan off (which removes it from GNPA entirely), whether to build floating buffers, how aggressively to restructure — all of these are management decisions that change net NPA, coverage and reported profit without changing a single borrower’s behaviour.
So two banks with identical loan books can report different net NPAs and different profits. The conservative one shows lower profit now and a bigger cushion later. Which is “better” depends on what happens next, which nobody knows. What you can do is read the provisioning policy in the notes and check whether coverage is rising or falling over time.
🧒 Explain it like I'm 10 (optional — skip if this is already clear)
You lend ₹100 each to ten friends. Two of them have stopped replying to your messages.
Gross NPA is the ₹200 those two owe you. You reckon you’ll probably get ₹130 back eventually, so you tell yourself you’ve “lost” ₹70 already — that ₹70 is your provision. Net NPA is the ₹130 you’re still hoping for.
Now, your friend Priya also lent ₹100 to the same ten people. She decides she’s lost ₹150, not ₹70. Same two non-payers, same ₹200 — but Priya reports a smaller net NPA and a worse year. Who’s right? Nobody knows yet. That’s why you look at both the gross number and how much each lender chose to set aside.
Reading the trend, not the level
A GNPA of 1.3% means little on its own. What tells you something:
- Direction of GNPA and the SMA buckets. Rising early-overdue balances precede rising NPAs by a few quarters.
- Slippages vs. recoveries. Filings usually disclose fresh slippages (loans newly turning NPA) and recoveries/upgrades. Gross NPA can fall because loans were written off, not because borrowers paid.
- Coverage trend. Coverage falling while GNPA rises means the buffer is being run down.
- Mix. Unsecured retail and microfinance carry higher NPA rates than home loans. A bank shifting mix toward higher-yield lending should be expected to show higher credit cost — that’s the trade, not a surprise.
Common mistakes
- Comparing GNPA across banks with different loan mixes. A home-loan lender and a credit-card lender at the same GNPA are in very different positions relative to their own norms.
- Reading a falling GNPA as recovery. Write-offs lower GNPA too. Check slippages and recoveries in the notes.
- Treating net NPA as “the real number.” It depends on provisioning policy. Gross NPA plus coverage tells you more than net NPA alone.
- Ignoring the timing. NPAs are recognised at 90 days; the loan may have been in trouble for a year. Provisions are the estimate of a loss that has already happened economically. The P&L catches up late by construction.
- Forgetting the interest effect. An NPA doesn’t just need a provision — it stops earning. A rising NPA book squeezes NIM and raises provisions at the same time.
Takeaway: Gross NPA is the loans that have stopped paying; net NPA is the part the bank hasn’t yet set money aside for; the provision coverage ratio is the bridge between them and credit cost is the year’s bill for all of it. HDFC Bank’s ₹10,900 crore floating provision, made in FY24 and not in FY25, is the cleanest illustration you’ll find that a bank’s reported profit is partly a decision.
This post is for educational purposes only and is not investment advice. Wealth Primer explains concepts, not recommendations — nothing here is a suggestion to buy, sell, or hold any specific security or fund. The author is not a SEBI-registered Research Analyst or Investment Adviser. Any prices or figures used as worked examples are historical and shown only to illustrate a calculation. Past performance does not indicate future results. Please do your own research or consult a registered adviser before making investment decisions. See the privacy & disclaimer policy for more.