
Fundamental Analysis — Beginner to Expert · Part 16 of 37
Why P/E and D/E break on a bank: the balance sheet is the business
The toolkit you’ve built doesn’t fit
Dozens of ratio posts, a DuPont tree, a DCF — and if you open the results of a bank and try to use any of it, almost everything either returns a meaningless number or can’t be computed at all.
Try debt-to-equity on HDFC Bank. Deposits plus borrowings come to about ₹27,14,714.9 crore plus ₹5,47,930.9 crore, against shareholders’ equity of ₹4,97,619.43 crore. That is a “D/E” of roughly 6.6. For a snacks manufacturer that number would mean insolvency by lunchtime. For a bank it is simply a description of what a bank is.
Try EBITDA margin. A bank has no “revenue” in the sense a manufacturer does, and interest — the thing EBITDA strips out as a financing cost — is the bank’s raw-material cost. Strip it out and there is nothing left to analyse.
Current ratio? Almost all of a bank’s liabilities are deposits its customers can withdraw at short notice, and most of its assets are loans due over years. Banks don’t even split their balance sheet into current and non-current, so there’s no current ratio to compute. Inventory days? There is no inventory.
This module is about the toolkit that replaces those. It uses HDFC Bank’s FY25 standalone results the way the earlier posts used Britannia’s: a real filing to compute from, not a company to form a view on.
What a bank actually sells
A manufacturer buys inputs, transforms them, sells the output, and keeps the difference. A bank does the same thing with money.
- Its raw material is other people’s money: deposits (the vast majority) and borrowings. It pays for that money — interest expended.
- Its product is credit: loans and advances, plus a book of investments (largely government bonds). It is paid for that — interest earned.
- The gross profit is the gap between the two: net interest income (NII).
Net interest income (NII) = Interest earned − Interest expended
Then, like any business, it has operating costs (branches, staff, technology), and a cost that is unique to lending: some loans don’t come back. Money set aside for those is provisions.
Pre-provision operating profit  =  NII + Other income − Operating expenses
Profit before tax               =  Pre-provision operating profit − Provisions
“Other income” is everything the bank earns that isn’t interest — fees, commissions, treasury gains, forex. For a large bank it is a big number in its own right.
HDFC Bank, FY25: the P&L built from the top
From HDFC Bank’s results for the year ended 31 March 2025 (standalone, audited; released 21 April 2025). ₹ crore. Historical figures, for illustration only.
| Item | FY25 | FY24 |
|---|---|---|
| Interest earned | 3,00,517.04 | 2,58,340.56 |
| − Interest expended | 1,77,846.95 | 1,49,808.1 |
| = Net interest income | 1,22,670.09 | 1,08,532.46 |
| + Other income | 45,632.28 | 49,240.99 |
| − Operating expenses | 68,174.89 | 63,386.01 |
| = Pre-provision operating profit | 1,00,127.48 | 94,387.44 |
| − Provisions and contingencies | 11,649.42 | 23,492.14 |
| − Tax | 21,130.7 | 10,083.03 |
| = Profit after tax | 67,347.36 | 60,812.27 |
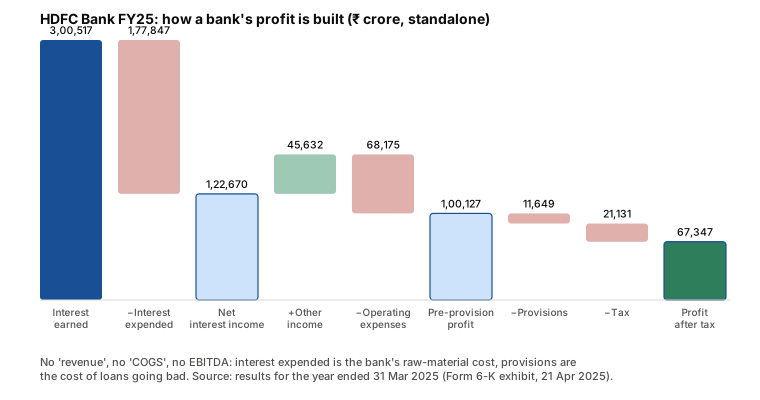
Two things to notice, because they recur through this module.
First, the scale of the funnel. Interest earned is ₹3,00,517.04 crore; what survives to shareholders is ₹67,347.36 crore — about 22%. A bank is a thin-margin business operating on an enormous base, which is why a shift of half a percentage point in any one line matters so much.
Second, look at the provisions row. It halved between FY24 and FY25 (down 50.4%), while pre-provision profit grew only 6.1%. Profit after tax grew 10.7% — and a good part of that growth came from the provisions line, not the lending line. FY24’s figure included a one-off ₹10,900 crore “floating” provision the bank chose to make; FY25’s didn’t. Two other lines moved too. Tax roughly doubled, from ₹10,083 crore to ₹21,131 crore, because FY24’s was held down by tax provisions written back. And FY24’s other income included a one-off gain of ₹7,341.42 crore from selling its shares in HDFC Credila, after which Credila stopped being a subsidiary (note 9 of HDFC Bank’s FY25 results release). The NPA post is about the provisions part: a bank’s profit is partly a decision.
The balance sheet is the business
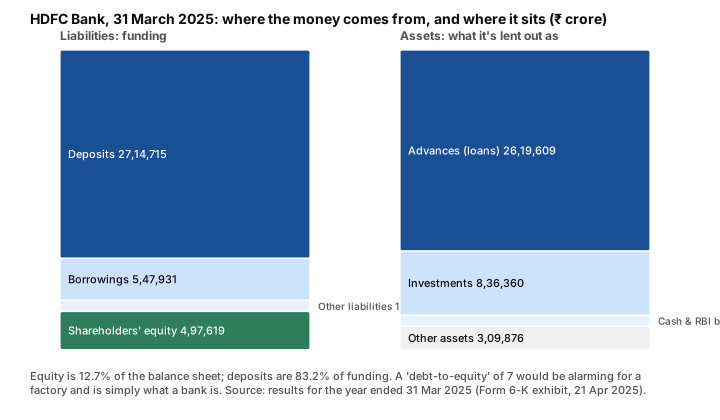
For a manufacturer, the balance sheet is the machinery that makes the product. For a bank, the balance sheet is the product. The loans are the sales; the deposits are the cost of goods.
| Funding (liabilities) | ₹ crore | Deployed as (assets) | ₹ crore |
|---|---|---|---|
| Deposits | 27,14,714.9 | Advances (loans) | 26,19,608.61 |
| Borrowings | 5,47,930.9 | Investments | 8,36,359.68 |
| Other liabilities | 1,46,128.52 | Cash and balances with the RBI (Reserve Bank of India) | 1,44,355.03 |
| Employee stock options outstanding | 3,805.19 | Balances with banks and call money | 95,215.65 |
| Shareholders’ equity | 4,97,619.43 | Fixed and other assets | 2,14,659.97 |
| Total | 39,10,198.94 | Total | 39,10,198.94 |
Equity is 12.73% of the balance sheet. Put differently, every ₹1 of shareholders’ money supports about ₹7.9 of assets. That leverage is not a warning sign; it is the engine. The whole of banking regulation — the subject of the capital adequacy post — exists to decide how thin that slice of equity is allowed to get.
And this is why the ordinary ratios fail. They were built for a company whose liabilities are a funding choice and whose assets are tools. A bank’s liabilities are its inventory and its assets are its sales ledger. Same words on the page, different objects underneath.
🧒 Explain it like I'm 10 (optional — skip if this is already clear)
Imagine a friend who borrows ₹100 from ten classmates, promising each of them ₹5 at the end of the year, and lends the ₹1,000 to older kids who promise to pay back ₹1,090.
At the end of the year your friend collects ₹1,090, pays the classmates ₹1,050, and keeps ₹40. That ₹40 is net interest income. If one older kid doesn’t pay back, the ₹40 disappears fast — that’s what provisions are for.
Now: your friend “owes” ₹1,000 and owns maybe ₹50 of their own money. Is your friend drowning in debt? No — owing lots of money to lots of people and lending it on is the entire business. You judge them by whether the older kids pay back, not by how much they owe the classmates.
Where the revenue comes from
HDFC Bank reports its revenue by business line. FY25, ₹ crore:
| Segment | Revenue | Share |
|---|---|---|
| Retail banking | 2,83,434.79 | 49% |
| Wholesale banking | 1,91,964.51 | 33% |
| Treasury | 62,227.48 | 11% |
| Other banking operations | 35,449.05 | 6% |
(Segment revenue totals more than the P&L’s interest earned plus other income because it includes inter-segment transfers — treasury “sells” funding to the lending businesses internally. Read it for proportions, not absolute size.)
The replacement toolkit
Here is the map for the rest of this module: for each ratio that breaks, the one that does the same job for a bank.
| Manufacturer ratio | What it asked | Bank equivalent | Covered in |
|---|---|---|---|
| Gross margin | What survives the cost of inputs? | Net interest margin (NIM) | The NIM post |
| Cost of raw material | How cheap are the inputs? | Cost of funds; CASA (current and savings account) ratio | The NIM and CASA posts |
| Debtor days | Are customers paying? | Gross and net NPA (non-performing assets), provision coverage, credit cost | The NPA post |
| Debt-to-equity, interest coverage | Can it survive a shock? | Capital adequacy ratio (CAR), CET1 (common equity tier 1) | The capital adequacy post |
| P/E, EV/EBITDA | What is the market paying? | Price-to-book, anchored on ROE | The price-to-book post |
Two old ratios survive nearly intact, because they were about the whole balance sheet to begin with: ROA and ROE. For a bank, ROA is the honest measure of how well it lends and ROE is what leverage does to that — the DuPont logic with the asset-turnover term collapsed to almost nothing. The price-to-book post leans on both.
Common mistakes
- Screening banks on debt-to-equity or “high debt.” Every screener will show a bank as the most indebted company in its universe. It means nothing. Look at capital adequacy instead.
- Reading a bank’s “other income” as a side show. At 27.1% of operating income for HDFC Bank, fees and treasury are a core line, and a volatile one. Its fall in FY25 is part of why pre-provision profit grew only 6.1%.
- Judging a bank’s year by profit after tax. Provisions sit between operating profit and PAT and are partly discretionary. Pre-provision operating profit is the cleaner read of the underlying business; PAT tells you what management decided to set aside.
- Applying a DCF. Free cash flow to a bank is close to meaningless — deposit growth shows up as “cash inflow” and lending as “outflow.” Bank valuation runs through book value and return on equity, which is where this module is heading.
Takeaway: A bank’s liabilities are its raw material and its loans are its sales, so debt-to-equity, EBITDA and the current ratio describe nothing when applied to one. Start again from the bank’s own P&L — interest earned, minus interest paid, minus costs, minus the loans that won’t come back — and its balance sheet, where ₹1 of equity supports about ₹7.9 of assets by design.
This post is for educational purposes only and is not investment advice. Wealth Primer explains concepts, not recommendations — nothing here is a suggestion to buy, sell, or hold any specific security or fund. The author is not a SEBI-registered Research Analyst or Investment Adviser. Any prices or figures used as worked examples are historical and shown only to illustrate a calculation. Past performance does not indicate future results. Please do your own research or consult a registered adviser before making investment decisions. See the privacy & disclaimer policy for more.