
Mutual Funds, Minus the Marketing · Part 7 of 23
SIP returns and XIRR: five years that returned nothing
The most marketed product in Indian finance
A SIP — systematic investment plan — invests a fixed amount at fixed intervals, usually monthly. It’s the default recommendation for Indian retail investors, and the reasoning behind it is genuinely sound: it automates the habit, it removes the need to decide when to invest, and buying a fixed rupee amount means you get more units when prices are low and fewer when they’re high.
That last effect is called rupee cost averaging, and it’s real.
It is also surrounded by claims that the data does not support. So this post does two things: shows you how to measure SIP returns properly, and then tests the claims against twenty years.
Why you can’t use CAGR
With a lump sum, CAGR works — one amount, one start date, one end date.
A SIP breaks that completely. Each instalment has been invested for a different length of time. The first has compounded for twenty years; last month’s has compounded for a month. There is no single “holding period.”
The measure that handles this is XIRR — extended internal rate of return: the single annual rate that makes the present value of all your cash flows equal zero.
Find r such that:

    Σ  CFₜ / (1 + r)^(daysₜ / 365.25)  =  0

where CFₜ = each instalment (negative, money out)
            plus the final value (positive, money in)
There’s no closed-form solution — it’s found numerically. Spreadsheets have
XIRR(); Python needs a root-finder. (Excel’s XIRR() divides by 365, not
365.25, so its answer can differ from the code below in the second decimal.)
🧒 Explain it like I'm 10 (optional — skip if this is already clear)
Imagine putting ₹100 into a jar every month for a year, and at the end the jar has ₹1,300 in it.
You put in ₹1,200, so you gained ₹100. But you can’t say “I earned 8.3%,” because your first ₹100 sat there all twelve months while December’s ₹100 sat there for about a week.
XIRR works out the growth rate that, applied to each ₹100 for however long that particular ₹100 was actually in the jar, adds up to ₹1,300. It’s the fair way to score money that arrived at different times.
Twenty years of ₹10,000 a month
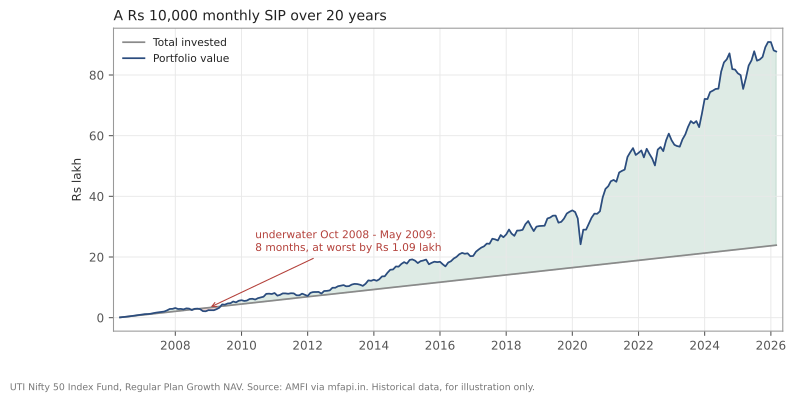
UTI Nifty 50 Index Fund, Regular Plan - Growth (AMFI scheme code 100822). Source: AMFI via mfapi.in. Historical data, for illustration only.
| Scenario | Instalments | Invested | Final value | XIRR |
|---|---|---|---|---|
| Full 20 years | 239 | ₹23,90,000 | ₹77,80,190 | 10.69% |
| Last 10 years | 120 | ₹12,00,000 | ₹20,75,891 | 10.57% |
| Last 5 years | 60 | ₹6,00,000 | ₹6,88,376 | 5.44% |
| Jan 2007 to Jan 2012, through the crash | 61 | ₹6,10,000 | ₹6,09,712 | −0.02% |
The full twenty-year row is the one that gets quoted: ₹23.9 lakh invested becomes ₹77.8 lakh. That’s a real result and a good advertisement for the habit.
Now read the fourth row.
Five years of discipline, and nothing to show
From January 2007 to January 2012, someone invested ₹10,000 every single month without fail — 61 instalments, ₹6,10,000 — straight through the worst crash in modern Indian market history, never missing, never panicking.
Their XIRR was −0.02%.
Five years of doing everything the marketing tells you to do, and the money came back essentially unchanged. Not a disaster. Not a gain either.
This is the fact that “SIPs protect you from market crashes” cannot survive. And here’s the part that surprises people: rupee cost averaging didn’t even come out ahead. The same ₹6,10,000 put in as a single lump sum in January 2007 was worth about ₹6,92,146 by January 2012 — roughly 2.56% a year. The lump sum bought near the top and still did better, because the SIP kept buying all the way through the 2010–11 highs too. Averaging changes your entry prices. It doesn’t guarantee better ones.
That makes the lesson sharper, not weaker. A SIP buys more units when prices fall, which lowers your average cost compared with the prices you paid. It does not make a falling market rise, and it doesn’t promise you’ll beat the money you could have invested on day one.
And the other side of the ledger
Being fair to SIPs, because the honest picture cuts both ways.
Across the full twenty-year run, the portfolio’s value sat below the total amount invested in only 12 of 239 months. The longest continuous stretch was 8 months, from October 2008 to May 2009, and the worst it ever looked was a deficit of about ₹1.09 lakh.
So: through a 60% crash, a disciplined SIP was underwater roughly 5% of the time. That’s a genuinely strong argument for the mechanism.
Both facts are true. A SIP was rarely underwater across twenty years, and a five-year SIP starting at the wrong moment returned nothing. Any presentation giving you only one of those is selling something.
The claims, tested
“SIP returns are guaranteed.” No. The fourth row returned −0.02%.
“SIPs beat lump sum investing.” Not reliably. In a rising market, lump sum wins, because money invested earlier compounds longer. SIPs win when markets fall early in the period. On this fund, a lump sum beat a five-year SIP of the same total in 170 of the 179 monthly start dates we could test — markets rose more often than they fell, so money invested earlier usually had longer to compound. SIPs are chosen mainly because most people receive money monthly, and because they remove the decision entirely. Even the Jan 2007 row, where the crash came early, went to the lump sum.
“Stop your SIP when markets are high.” This is timing, wearing a SIP costume. It requires knowing what “high” means in advance. The Jan 2007 row cuts both ways here. In hindsight, pausing through the 2010–11 highs would have helped this SIP. But you’d have needed to know in 2010 that those were highs, and not the start of another leg up — and the same rule would have had you pause in 2007 and miss the cheapest units of 2008–09. What counted as “high” is only obvious afterwards.
“SIP averaging means you can’t lose.” Averaging lowers your average purchase price. It cannot make a five-year decline profitable.
“Longer SIPs always work.” The 20-year record here is good. It is one market, one period. The rolling returns post made the same caution about any historical distribution.
Doing it in Python
import pandas as pd
from scipy.optimize import brentq

nav = pd.read_csv("uti-nifty50-index-fund-nav.csv",
                  parse_dates=["date"]).set_index("date")
r = nav.nav_regular_growth.dropna()

def xirr(flows):                       # flows: list of (date, amount)
    t0 = flows[0][0]
    npv = lambda rate: sum(cf / (1 + rate) ** ((t - t0).days / 365.25)
                           for t, cf in flows)
    return brentq(npv, -0.99, 10)

def sip(series, start, end, amount=10000):
    units, flows = 0.0, []
    for d in pd.date_range(start, end, freq="MS"):
        price = series.asof(d)
        if pd.isna(price):             # NAV not published yet — skip
            continue
        units += amount / price
        flows.append((d, -amount))
    value = units * series.asof(pd.Timestamp(end))
    flows.append((pd.Timestamp(end), value))
    return len(flows) - 1, value, xirr(flows) * 100

n, value, rate = sip(r, "2007-01-01", "2012-01-01")
print(f"{n} instalments, value Rs {value:,.0f}, XIRR {rate:.2f}%")
That if pd.isna(price): continue is not decoration. The first scheduled
instalment of the twenty-year run falls on 1 April 2006, before the fund’s
first published NAV on 3 April — which is why the table says 239 instalments
and not 240. Getting this wrong silently overstates what you invested.
Common mistakes
- Using CAGR on a SIP. Different instalments have different holding periods. XIRR exists for exactly this.
- Comparing a SIP’s XIRR to a lump sum’s CAGR. They measure different things over different exposure profiles.
- Believing averaging removes risk. It improves your average price. It cannot turn a falling market into a rising one.
- Stopping a SIP when markets fall. This inverts the mechanism — the cheap units are the entire benefit.
- Pausing a SIP when markets look “high.” That’s market timing, and it needs the same impossible foresight as any other timing decision.
- Judging a SIP over a period shorter than the asset’s drawdown recovery. The 2008 recovery took almost six years. A three-year SIP horizon in equity is a bet on not meeting one of those.
Takeaway: XIRR is the right way to measure a SIP, because each instalment has been invested for a different length of time. Measured properly, a twenty-year SIP into this fund turned ₹23.9 lakh into ₹77.8 lakh — and a five-year SIP starting January 2007 returned −0.02%. The habit is excellent; the guarantee it’s usually sold with does not exist.
This post is for educational purposes only and is not investment advice. Wealth Primer explains concepts, not recommendations — nothing here is a suggestion to buy, sell, or hold any specific security or fund. The author is not a SEBI-registered Research Analyst or Investment Adviser. Any prices or figures used as worked examples are historical and shown only to illustrate a calculation. Past performance does not indicate future results. Please do your own research or consult a registered adviser before making investment decisions. See the privacy & disclaimer policy for more.