
Mutual Funds, Minus the Marketing · Part 14 of 30
Why star ratings mislead — and why the same fund can swing from five stars to two
What a star rating actually is
Every fund platform shows stars. Few people know what they measure, so here is the general recipe most rating agencies follow (each has its own variations — this is the common shape, not any one firm’s method):
- Take every fund in a category (large cap, gilt, and so on).
- For each fund, compute a trailing return — usually over 3 and 5 years — adjusted for some measure of risk (volatility, downside deviation, or a utility function that penalises losses).
- Rank the funds. Top 10% get five stars, next 22.5% four, middle 35% three, and so on down a fixed distribution (that split is Morningstar’s; other agencies use similar bell-shaped ones).
- Repeat monthly.
Notice three things built into that. It is relative — a five-star fund in a category that lost 30% is the fund that lost least. It is trailing — it summarises what already happened. And it is categorical — the category definition decides who is compared with whom.
None of that is dishonest. A rating is a compact, consistent way of saying “over the last three to five years, this fund’s risk-adjusted return ranked here among its peers”. The trouble is what people hear: a prediction.
The input swings wildly — on the same fund
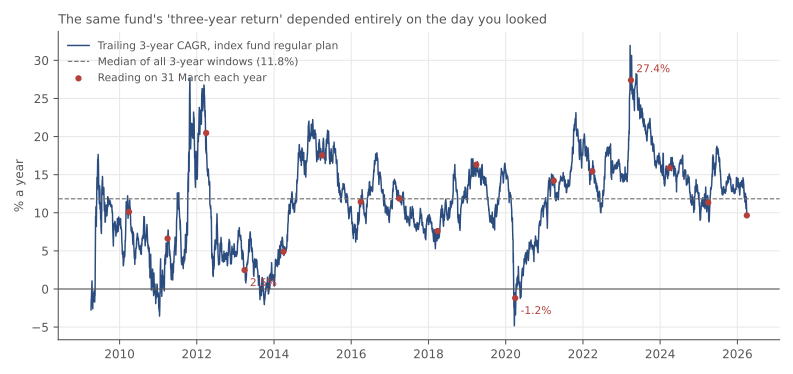
The single biggest driver of a rating is the trailing return. Here is that number for one fund — the Nifty 50 index fund this series has used throughout — read off on 31 March each year. A passive fund: no manager, no strategy change, the same fifty stocks the whole time. Source: AMFI via mfapi.in, regular plan, 3 April 2006 to 31 March 2026. Historical data, for illustration only.
| Read on | Trailing 3-year return (a year) | Percentile within the fund’s own history |
|---|---|---|
| 2010-03-31 | 10.12% | 39 |
| 2011-03-31 | 6.62% | 23 |
| 2012-03-30 | 20.47% | 94 |
| 2013-03-28 | 2.48% | 7 |
| 2014-03-31 | 4.89% | 16 |
| 2015-03-31 | 17.54% | 87 |
| 2016-03-31 | 11.43% | 47 |
| 2017-03-31 | 11.86% | 50 |
| 2018-03-28 | 7.6% | 26 |
| 2019-03-29 | 16.31% | 80 |
| 2020-03-31 | −1.19% | 1 |
| 2021-03-31 | 14.2% | 66 |
| 2022-03-31 | 15.44% | 76 |
| 2023-03-31 | 27.4% | 100 |
| 2024-03-31 | 15.9% | 79 |
| 2025-03-31 | 11.35% | 47 |
| 2026-03-31 | 9.65% | 36 |
The same fund’s “three-year return” — the headline input to a rating — ranged from −4.82% to 31.95% a year across all the dates it could have been read. On 31 March 2020 it was negative. Three years later it was 27%.
Nothing about the fund changed. The window changed. That’s the first lesson: most of a trailing return is simply what the market did over those three years, not anything the fund did.
The ranking point is separate. A rating compares a fund against peers, not against its own history — and in March 2020 every Nifty fund fell together, so this fund’s rank among them would barely have moved. Peers swing with the same market, which makes the stars steadier than these raw figures. But it also means the ranking is decided by the small differences between funds’ trailing returns, and those differences are mostly which fund happened to be tilted the right way for the window that just closed. When the window rolls on and a different tilt wins, a small gap in return can be enough to move a fund from the top tenth of its category to the bottom third — five stars to two, with the fund itself unchanged.
🧒 Explain it like I'm 10 (optional — skip if this is already clear)
Imagine rating a cricket batter with stars based only on their last three matches. After three good pitches, five stars. After three rainy games, two stars. Same batter.
Now imagine picking your team for next season from those stars. You’d mostly be picking whoever got the friendliest pitches recently — which tells you very little about next season’s pitches.
Does a good past three years predict a good next three?
This is the question the stars are silently answering “yes” to, so it’s worth checking on data. Take the index fund’s trailing three-year return at every month-end, and pair it with the return over the following three years. 168 such pairs exist in the data.
| Item | Past 3-year return (average) | Next 3-year return (average) |
|---|---|---|
| Top quarter of past readings | 17.95% a year | 12.65% a year |
| Bottom quarter of past readings | 3.07% a year | 12.29% a year |
| Correlation, past vs next | 0.05 |
The dates when the fund had just delivered its best three-year stretches (averaging 17.95% a year) were followed by three years averaging 12.65%. The dates when it had just delivered its worst (averaging 3.07%) were followed by three years averaging 12.29%. Essentially the same. The correlation between past and next is 0.05 — no detectable relationship in this sample. Hold that number loosely, though: neighbouring month-ends share almost all of their three-year windows, so those 168 pairs contain only about five or six genuinely independent three-year periods. That’s enough to rule out strong persistence here, not enough to prove there’s none.
This is one fund, and a passive one, so it isolates the market’s contribution to a trailing return: none of it persisted. The academic evidence on active funds points the same way — outperformance over one window is a weak predictor of the next, and the strongest persistent signal is cost, which the expense ratio post covered. Morningstar’s own study (Russel Kinnel, “How Expense Ratios and Star Ratings Predict Success”, August 2010) found that low expense ratios predicted a fund’s future success more reliably than its star rating did.
Two more things ratings can’t see
Survivorship. Funds that do badly get merged into siblings or wound up. Their records vanish from the category. The peer group a five-star fund is ranked against is therefore missing its worst members — every survivor’s rank is flattered a little by the ghosts.
The category itself. A rating tells you a fund ranked well within its category. It says nothing about whether that category — small cap, credit risk, sectoral — belongs in your portfolio at all. Five stars on a credit-risk fund is still 65% in bonds rated AA and below.
What ratings are good for
Not nothing. Used as intended:
- Screening out the persistently bad. A fund with one or two stars for several consecutive years has usually earned it — persistent underperformance is more predictable than persistent outperformance, and it is usually costs.
- A quick risk-adjustment. Most ratings penalise volatility or downside, so a five-star fund at least didn’t get its return by taking wild risks in the window measured.
- A prompt to read the factsheet, not a substitute for it. The factsheet post covers what to look at instead: mandate, cost, portfolio, and rolling returns across many windows rather than the one that just closed.
Common mistakes
- Reading stars as a forecast. They summarise the window that just closed. On this data, that window had no predictive power for the next.
- Switching funds when a rating drops. The drop usually means the trailing window rolled off a good stretch. Selling then is buying high and selling low with extra steps — and a taxable event.
- Comparing stars across categories. A five-star gilt fund and a five-star small-cap fund are not comparable in any way.
- Ignoring how many funds are in the category. In a category of twelve, “top 10%” is one fund.
- Forgetting who the rating is for. Ratings drive flows; fund houses know which windows flatter them and market accordingly. Treat the stars on an advertisement as marketing.
Sources
- AMFI, net asset value data: the NAV history behind the figures in this post.
Takeaway: A star rating ranks a fund’s trailing risk-adjusted return within its category — it describes the weather that was, not the weather to come. On a passive Nifty index fund that trailing figure swung from −1% to 27% a year depending on which year you read it, and the best past three-year stretches were followed by the same returns as the worst.
This post is for educational purposes only and is not investment advice. Wealth Primer explains concepts, not recommendations — nothing here is a suggestion to buy, sell, or hold any specific security or fund. The author is not a SEBI-registered Research Analyst or Investment Adviser. Any prices or figures used as worked examples are historical and shown only to illustrate a calculation. Past performance does not indicate future results. Please do your own research or consult a registered adviser before making investment decisions. See the privacy & disclaimer policy for more.