
Technical Analysis — Zero to Hero · Part 8 of 22
MACD: two averages in an argument, and 31 signals in 460 days
Turning two averages into one line
The moving averages post ended on a trade-off: a fast average reacts quickly and gives false alarms, a slow one is reliable and late. The MACD — Moving Average Convergence Divergence, built by Gerald Appel in the late 1970s — takes that tension and makes it the measurement itself.
Instead of watching two averages and waiting for them to cross, MACD plots the gap between them as a single line. When the fast average is far above the slow one, the gap is large and positive — the recent trend is accelerating away from the longer-term one. When they converge, the gap shrinks toward zero. When the fast falls below the slow, it goes negative.
So MACD is a momentum measure derived entirely from moving averages. That makes it a lagging indicator built out of lagging indicators, which is worth holding in mind throughout.
The formula
MACD line   = EMA(12) − EMA(26)              the gap between fast and slow
Signal line = EMA(9) of the MACD line        a smoothed version of that gap
Histogram   = MACD line − Signal line        the gap between those two
Three components, each one derived from the one before it:
| Component | What it shows |
|---|---|
| MACD line | How far the 12-day average has pulled away from the 26-day |
| Signal line | The MACD’s own recent average — slower, smoother |
| Histogram | Whether the MACD is pulling away from, or falling back toward, its own average |
The 12, 26 and 9 are Appel’s original settings and have no special significance beyond convention — they roughly correspond to two weeks, a month, and a week and a half of trading days back when markets traded six days a week.
🧒 Explain it like I'm 10 (optional — skip if this is already clear)
Two people are walking the same route: a fast walker and a slow one.
The MACD line is simply how far ahead the fast walker is. When they’re racing off, the gap grows. When they get tired, the gap shrinks. If they fall behind the slow walker, the gap goes negative.
The signal line is the average gap over the last little while. And the histogram is whether today’s gap is bigger or smaller than that recent average — in other words, whether the fast walker is pulling away or fading.
None of this tells you where the road goes. It only tells you about the walkers.
The three readings
Practitioners look at MACD three ways:
- Signal-line crossovers. MACD crossing above its signal line is read as bullish; below, bearish. This is the most commonly used and, as we’re about to see, the noisiest.
- Zero-line crossings. MACD crossing above zero means the 12-day average has crossed above the 26-day — a slower, more meaningful shift.
- Divergence. Price makes a new high, MACD doesn’t. Same logic as RSI divergence.
The chart, and the whipsaw problem
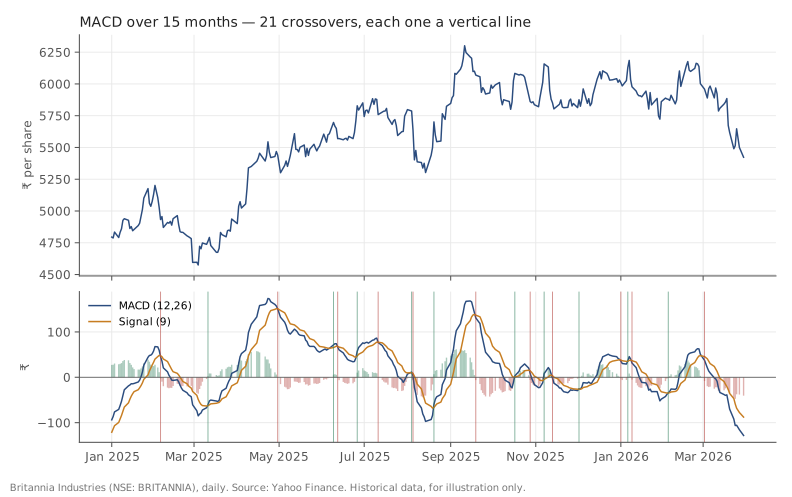
Britannia (NSE: BRITANNIA), daily, January 2025 to March 2026. Source: Yahoo Finance. Historical data, for illustration only. Each vertical line marks a signal-line crossover.
Count the vertical lines and you’ll find 21 crossovers. (The line on the very left edge is an artefact of where the chart window starts, not a crossover.) The chart only shows January 2025 onward, though. Across the full two-year dataset there are more:
| Item | |
|---|---|
| Bullish crossovers | 15 |
| Bearish crossovers | 16 |
| Total | 31 |
| Over | 460 trading days |
| That’s one signal every | ~15 trading days |
Thirty-one signals in under two years — roughly one every three weeks. And they cluster: look at the dense groups in mid-2025 and again around the turn of 2026, where crossovers arrive within days of each other in alternating directions.
That clustering is whipsaw, and it’s the defining problem with crossover-based indicators. When price moves sideways, the fast and slow averages sit almost on top of each other, and tiny wiggles flip the gap back and forth. Every flip is technically a signal. Most of them are noise about noise.
Notice also when the whipsaws happen: precisely during the ranging periods when there’s no trend to catch. The indicator is quietest and most useful in strong trends — which are exactly the conditions in which you least needed an indicator to tell you the direction.
What MACD is actually good for
Given all that, the fairer summary: MACD is a reasonable way to visualise whether momentum is building or fading, and a poor standalone trigger.
The histogram is the genuinely useful part. When bars are growing, the gap between MACD and its signal is widening — momentum is accelerating. When they’re shrinking, momentum is fading even if price is still rising. That fading-while-rising condition is real information, and it’s visible on the histogram before it’s visible in the crossover.
Zero-line crossings are also more meaningful than signal crossings, simply because they happen far less often and require an actual shift in the relationship between the two underlying averages.
Doing it in Python
import pandas as pd

df = pd.read_csv("britannia-ohlcv-2024-04-to-2026-03.csv",
                 parse_dates=["date"]).set_index("date")

ema12 = df.close.ewm(span=12, adjust=False).mean()
ema26 = df.close.ewm(span=26, adjust=False).mean()
df["macd"]   = ema12 - ema26
df["signal"] = df.macd.ewm(span=9, adjust=False).mean()
df["hist"]   = df.macd - df.signal

# count crossovers, skipping the warmup
x = (df.macd > df.signal).astype(int).diff().iloc[35:]
print(f"bullish {int((x == 1).sum())}, bearish {int((x == -1).sum())}")
adjust=False matters — it’s what makes pandas’ EMA follow the standard
recursive definition every charting package uses, so the values match once
the warmup is behind you (packages seed the first value differently). With the default
adjust=True you’ll get subtly different values and wonder why your numbers
don’t match your broker’s terminal.
Common mistakes
- Trading every crossover. Thirty-one signals in two years on one stock, clustered exactly where they’re least informative.
- Forgetting it’s a lagging indicator built from lagging indicators. Two EMAs, then a third EMA of their difference. It is structurally incapable of leading price.
- Comparing MACD values across stocks. MACD is measured in rupees — it’s a difference between two prices. A ₹40 MACD on a ₹6,000 stock and on a ₹200 stock mean completely different things.
- Quoting values from the warmup. The 26-day EMA plus a 9-day EMA of the result needs roughly 35 bars before it settles.
- Optimising 12/26/9. Those numbers are a 1970s convention. Any “better” set found by searching past data is mostly fitted to that data’s noise.
- Reading divergence as a timing signal. As with RSI, divergences describe fading momentum and can persist for a long time.
Takeaway: MACD plots the gap between a fast and a slow moving average, then compares that gap to its own average — a clear way to see momentum building or fading. But it produced 31 crossover signals in under two years here, bunched precisely in the sideways stretches where they were least useful, which is why the histogram’s shape is worth more than the crossover it eventually produces.
This post is for educational purposes only and is not investment advice. Wealth Primer explains concepts, not recommendations — nothing here is a suggestion to buy, sell, or hold any specific security or fund. The author is not a SEBI-registered Research Analyst or Investment Adviser. Any prices or figures used as worked examples are historical and shown only to illustrate a calculation. Past performance does not indicate future results. Please do your own research or consult a registered adviser before making investment decisions. See the privacy & disclaimer policy for more.