
Technical Analysis — Zero to Hero · Part 7 of 22
RSI indicator explained: formula and three times it was wrong
From price to momentum
Everything so far has looked at price directly — where it went, where it stalled, what its average is doing, and how much volume came with it. Oscillators ask a different question: not where is the price, but how fast has it been moving, and is that pace sustainable?
The RSI — Relative Strength Index, devised by J. Welles Wilder in 1978 — is the most widely used of them. It compresses recent price action into a single number between 0 and 100, measuring how much of the recent movement has been upward versus downward.
Note the name is misleading: RSI has nothing to do with strength relative to another stock or to an index. It’s entirely self-contained — a stock compared only to its own recent behaviour.
The formula
             100
RSI = 100 − ───────           RS = Average Gain / Average Loss
            1 + RS                 over N periods (N = 14 by default)
The averaging is Wilder’s smoothing — a running average that weights recent periods more heavily, equivalent to an exponential average with α = 1/N, started from a plain average of the first N periods.
Work through what the formula does:
- If every one of the last 14 days rose, average loss is zero, RS is infinite, and RSI is 100.
- If every day fell, average gain is zero, RS is zero, and RSI is 0.
- If gains and losses have been equal on average, RS is 1 and RSI is 50.
So RSI is a bounded measure of how one-sided recent movement has been. That’s all it is. Everything else is interpretation laid on top.
🧒 Explain it like I'm 10 (optional — skip if this is already clear)
Imagine you’re sprinting. Someone measures how hard you’ve been running over the last fourteen minutes and gives you a score out of 100.
A score of 90 means you’ve been sprinting flat out almost the whole time. And the sensible thought is: you probably can’t keep this up.
But “probably can’t keep it up” is not the same as “is about to stop.” Some runners keep sprinting for a very long time. If you bet on every tired-looking runner stopping immediately, you’d lose a lot of bets.
The conventional interpretation
| RSI | Conventional label |
|---|---|
| Above 70 | “Overbought” |
| Below 30 | “Oversold” |
| Around 50 | Neutral |
The words overbought and oversold do a lot of damage, because they sound like statements about value. They aren’t. “Overbought” does not mean too expensive — it means the price has risen persistently for a couple of weeks. A great business in a strong uptrend can stay “overbought” for weeks at a stretch, and it isn’t wrong; it’s just rising.
The chart, and three signals that disagreed
Two years of Britannia, with RSI underneath:
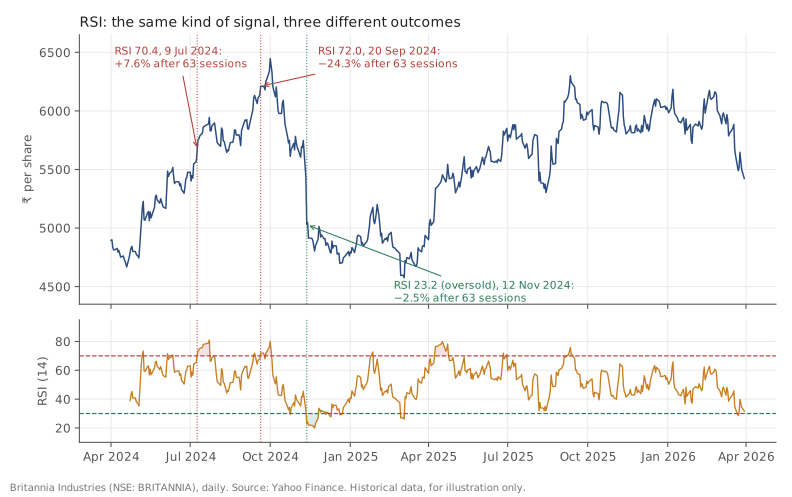
Britannia (NSE: BRITANNIA), daily bars, 1 April 2024 to 30 March 2026. Source: Yahoo Finance. Historical data, for illustration only.
Across this period RSI spent 42 days above 70 and 18 days below 30. Three of those episodes are worth putting side by side, because they point in different directions and they are all real. Each outcome is measured over the same fixed window — 63 sessions, about three months — rather than to whatever peak or trough came later, which you could only pick with hindsight:
| Signal | Date | RSI | 63 sessions later |
|---|---|---|---|
| Overbought | 2024-07-09 | 70.4 | Up a further 7.6% (2024-10-09) |
| Overbought | 2024-09-20 | 72.0 | Down 24.3% (2024-12-23) |
| Oversold | 2024-11-12 | 23.2 | Down a further 2.5% (2025-02-11) |
Read those three rows carefully, because they are the honest summary of what this indicator is.
In July 2024 RSI crossed 70 and the stock climbed another 7.6% over the next three months. Anyone acting on “overbought” then would have exited near the start of the best stretch in the dataset.
In September 2024 RSI crossed 70 again — at a nearly identical reading — and this time the stock fell 24.3% over the following three months. Same signal, opposite outcome.
And in November 2024 RSI dropped to 23.2, deeply “oversold,” and three months later the price was still 2.5% lower — no bounce to speak of.
There is no way to tell these apart at the time. That isn’t a failure of this particular dataset — it’s the well-known central weakness of oscillators: in a strong trend, they stay pinned at an extreme, and the extreme reading is a description of the trend rather than a warning about it.
Divergence
The more interesting use of RSI, and the one experienced practitioners usually prefer, is divergence — when price and RSI disagree.
- Bearish divergence: price makes a higher high, RSI makes a lower high. The new peak was reached with less momentum than the last one.
- Bullish divergence: price makes a lower low, RSI makes a higher low. The new trough came with less downward force.
The logic is more defensible than the overbought/oversold reading, because it’s a comparison between two moments rather than a fixed threshold applied blindly. It is also considerably harder to use: divergences can persist for a long time before anything happens, and they’re much easier to identify after the fact than during.
Doing it in Python
Getting the smoothing right matters — a plain rolling mean is not Wilder’s method and will give you different numbers. Wilder starts with a simple average of the first 14 gains and losses, then smooths from there:
import pandas as pd

df = pd.read_csv("britannia-ohlcv-2024-04-to-2026-03.csv",
                 parse_dates=["date"]).set_index("date")

delta = df.close.diff()
gain = delta.clip(lower=0)
loss = -delta.clip(upper=0)

n = 14
avg_gain = gain.rolling(n).mean()     # seed: plain average of the first 14 changes
avg_loss = loss.rolling(n).mean()
for i in range(n + 1, len(df)):       # then Wilder's smoothing, one bar at a time
    avg_gain.iloc[i] = (avg_gain.iloc[i-1] * (n-1) + gain.iloc[i]) / n
    avg_loss.iloc[i] = (avg_loss.iloc[i-1] * (n-1) + loss.iloc[i]) / n

df["rsi"] = 100 - 100 / (1 + avg_gain / avg_loss)
print(df.rsi.dropna().describe().round(1))    # first value: bar 14
You’ll often see a one-line shortcut instead:
gain.ewm(alpha=1/n, adjust=False).mean(). It uses the same smoothing but
starts from the very first bar with no seed — so its first RSI value in this
dataset is exactly 100.0, purely because no down-day had happened yet.
That’s an artefact of having no history, not a reading, and the shortcut stays
off from Wilder’s version by up to 12 points for the first few weeks here. The
two only agree after roughly 50–100 bars. The same applies to your broker’s
chart: two RSI readings on the same stock only match once both have enough
history behind them. Every indicator has a warmup period, and quoting values
from inside it is a real mistake, not a technicality.
Common mistakes
- Reading “overbought” as “expensive.” It means the price has risen steadily for a fortnight. Nothing more.
- Acting on threshold crossings in a strong trend. This is the failure mode the table above documents three times over. In trends, oscillators pin.
- Using values from the warmup window. The shortcut’s first RSI reading here is 100.0 and means nothing at all.
- Assuming a rolling mean is Wilder’s smoothing. They give different numbers, and much published RSI code gets this wrong.
- Tuning the period until the signals look good. RSI(14) is Wilder’s convention. RSI(9) or RSI(21) will look better on data you’ve already seen, which is exactly the problem.
- Treating divergence as a timing tool. Divergences can run for months. They describe a loss of momentum, not an appointment.
Takeaway: RSI measures how one-sided the last fourteen sessions have been, on a 0–100 scale, and that’s genuinely useful information about pace. But “overbought” is a statement about speed, not value — and in this dataset the same reading above 70 preceded a further 7.6% rise once and a 24.3% fall another time, three months on each, which is roughly all you need to know about using the threshold on its own.
This post is for educational purposes only and is not investment advice. Wealth Primer explains concepts, not recommendations — nothing here is a suggestion to buy, sell, or hold any specific security or fund. The author is not a SEBI-registered Research Analyst or Investment Adviser. Any prices or figures used as worked examples are historical and shown only to illustrate a calculation. Past performance does not indicate future results. Please do your own research or consult a registered adviser before making investment decisions. See the privacy & disclaimer policy for more.