
Technical Analysis — Zero to Hero · Part 19 of 22
Stochastic oscillator: RSI's cousin, tested the same way
A second oscillator, and why it looks familiar
The RSI post introduced the RSI (Relative Strength Index): a 0–100 score for how one-sided the last fourteen sessions were. The stochastic oscillator, usually credited to George Lane, asks a closely related question in a different way:
Where did today’s close land inside the range of the last fourteen sessions?
A close at the very top of the recent range scores 100. A close at the very bottom scores 0. Readings above 80 get called “overbought” and below 20 “oversold”. Those are the same words RSI uses, with the same problem: they describe where price has been, not where it’s going.
The formula
Fast %K = 100 × (Close − Lowest low of last 14 sessions)
              / (Highest high of last 14 sessions − Lowest low of last 14)

Slow %K = 3-session simple average of Fast %K       ← the line most charts show
%D      = 3-session simple average of Slow %K       ← the "signal" line

Conventional labels:  Slow %K > 80 "overbought",  < 20 "oversold"
This is the common “slow stochastic (14, 3, 3)” setting. Fast %K jumps around too much for most people, so charting platforms usually show the smoothed version by default. Check which one yours uses before comparing numbers.
🧒 Explain it like I'm 10 (optional — skip if this is already clear)
Think of the last fourteen days as a staircase. The lowest step is the cheapest price and the top step is the most expensive.
The stochastic tells you which step today’s price is standing on. Top step: 100. Bottom step: 0. Halfway: 50.
Standing on the top step doesn’t mean you’re about to fall down the stairs. Sometimes a new, higher step gets built tomorrow and you climb onto that.
A worked example
Britannia (NSE: BRITANNIA) on 30 March 2026, the last day in this blog’s dataset. Historical, for illustration only.
| Step | Value |
|---|---|
| Close | ₹5,423 |
| Lowest low, last 14 sessions | ₹5,364.5 |
| Highest high, last 14 sessions | ₹5,995 |
| Fast %K = 100 × (close − low) ÷ (high − low) | 9.3 |
| Fast %K on the two sessions before | 16.2, 39.9 |
| Slow %K = average of the three | 21.8 |
| %D = average of the last three slow %K values | 22.2 |
The close was near the bottom of its two-week range, so fast %K was low. The slow line, averaging three days, was still just above 20. Same stock, same day, and whether it counts as “oversold” depends on which line you read.
How close a cousin is it?
Both indicators are built from the same few weeks of prices, and they mostly agree. Over the 395 scored sessions of Britannia, the correlation between slow %K and RSI(14) was 0.83. On the Nifty it was 0.84. A correlation of 1 would mean they always move together. At above 0.8, they’re mostly two views of the same thing.
The real difference is how often they hit their thresholds. Over the same sessions, slow %K spent 23% of days below 20 and 20% above 80. RSI spent 5% below 30 and 7% above 70. The stochastic is at an “extreme” far more often. A signal that fires several times as often isn’t several times as informative. Mostly, it’s noisier.
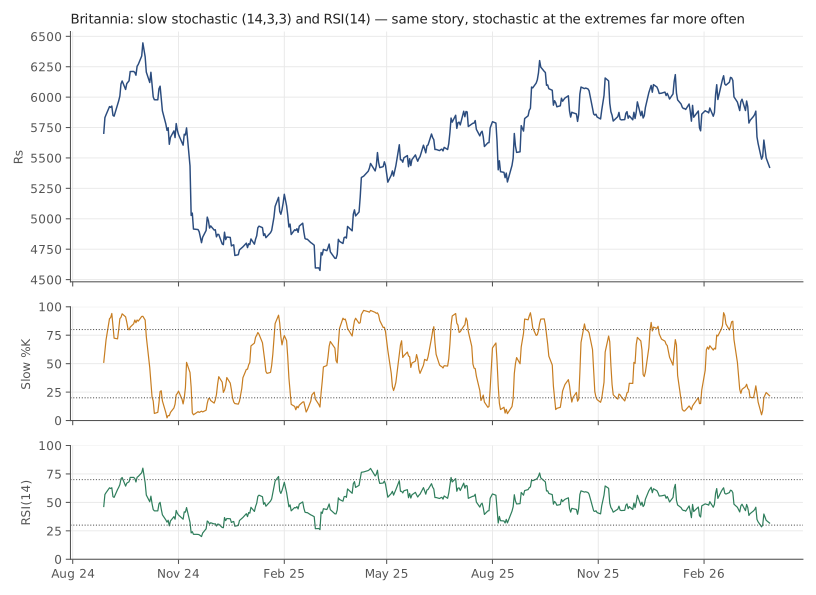
Britannia (NSE: BRITANNIA), daily bars, 1 April 2024 to 30 March 2026. Source: Yahoo Finance. Historical data, for illustration only.
The test
The same test as the backtesting post recommends, applied the same way to both indicators:
- Event: the first day slow %K crosses below 20 (or above 80), and for RSI the first day it crosses below 30 (or above 70). Staying below 20 for a week counts once, not five times.
- Outcome: the return over the next 20 sessions, fixed. Events without 20 sessions of data after them are dropped.
- Base rate: the same 20-session return, on every scored day.
- Shuffle check: draw random sets of ordinary days, the same size as the events, and see how often they do at least as well as the folklore says the events should.
Both indicators are scored from the 100th session on, so RSI’s warm-up period doesn’t distort anything and both share one base rate.
Britannia, 395 scored sessions:
| After… | Events | Average 20-session return | Median | Share positive |
|---|---|---|---|---|
| Stochastic crosses below 20 | 18 | −0.17% | 0.37% | 50% |
| Stochastic crosses above 80 | 16 | −0.72% | −2.64% | 31.2% |
| RSI crosses below 30 | 6 | −1.07% | −0.25% | 50% |
| RSI crosses above 70 | 8 | −3.39% | −3.8% | 12.5% |
| Any day (base rate) | 375 | 0.01% | 0.46% | 53.6% |
On Britannia, “oversold” readings were not followed by bounces: the average after the stochastic’s oversold readings was about the same as any day, and after RSI’s it was lower. “Overbought” readings were followed by weaker returns, most of all for RSI, where 8 events had an average of −3.39%. In the shuffle, 8% of random sets of 8 days did as badly. Suggestive, on eight events. And on this same stock, the RSI post showed one overbought reading followed by a rise and another followed by a fall.
Two years of one stock can’t settle this, so here’s more data.
Nifty 50, 18.5 years. The Nifty file has only closing prices, so the “highest high” and “lowest low” here are the highest and lowest close of the last 14 sessions. The mechanics are identical; the readings are a little more extreme than a high/low version would give.
| After… | Events | Average 20-session return | Median | Share positive | Random sets doing at least as well for the folklore |
|---|---|---|---|---|---|
| Stochastic crosses below 20 | 179 | 1.42% | 1.89% | 63.1% | 9% |
| Stochastic crosses above 80 | 205 | 0.9% | 0.88% | 62.9% | 52% |
| RSI crosses below 30 | 50 | 0.34% | 1.16% | 64% | 74% |
| RSI crosses above 70 | 104 | 1.56% | 1.15% | 64.4% | 89% |
| Any day (base rate) | 4,426 | 0.87% | 1.01% | 60.1% |
“Doing at least as well for the folklore” means a higher return for oversold readings and a lower one for overbought. Events without 20 sessions after them are dropped: 1 for the stochastic, 5 for RSI, all of them oversold readings.
On the index, the results partly contradict the Britannia table, which is exactly why one chart shouldn’t be trusted:
- Stochastic “oversold” was followed by a somewhat higher average than an ordinary day. Only 9% of random sets did as well. That’s the closest thing to support for the folklore in this post. The difference is about half a percentage point over a month, before costs, on events that often overlap.
- Stochastic “overbought” was followed by about the same as any day. No warning at all.
- RSI “overbought” on the Nifty was followed by higher than average returns. The “sell” reading, if anything, came before gains, as it does when a trend is strong.
Doing it in Python
import pandas as pd

df = pd.read_csv("britannia-ohlcv-2024-04-to-2026-03.csv",
                 parse_dates=["date"]).set_index("date")

low14, high14 = df.low.rolling(14).min(), df.high.rolling(14).max()
fast_k = 100 * (df.close - low14) / (high14 - low14)
slow_k = fast_k.rolling(3).mean()
slow_d = slow_k.rolling(3).mean()

k = slow_k.iloc[100:]                              # same scored window as the post
fwd = (df.close.shift(-20) / df.close - 1).iloc[100:]
cross_dn = (k < 20) & (k.shift() >= 20)            # first day only
print("after crossing below 20:", fwd[cross_dn].dropna().describe().round(3))
print("any day:", fwd.dropna().describe().round(3))
Common mistakes
- Treating stochastic and RSI as two confirmations. With a correlation above 0.8, one agreeing with the other isn’t independent evidence. It’s mostly the same measurement twice.
- Counting every day below 20 as a separate signal. A week spent below 20 is one event. Counting it five times makes the sample look bigger and more certain than it is.
- Mixing up fast and slow. On the worked day above, fast %K said “deeply oversold” and slow %K said “just above 20”. Know which line you’re reading.
- Trusting the result from one stock. Britannia’s overbought readings preceded weaker returns; the Nifty’s preceded ordinary or stronger ones. Neither sample alone would have told you that.
Takeaway: The stochastic measures where today’s close sits in the recent range, and it tracks RSI closely enough to be mostly the same signal. Its 80/20 readings fire far more often, and in these tests they didn’t reliably come before the reversals their labels promise.
This post is for educational purposes only and is not investment advice. Wealth Primer explains concepts, not recommendations — nothing here is a suggestion to buy, sell, or hold any specific security or fund. The author is not a SEBI-registered Research Analyst or Investment Adviser. Any prices or figures used as worked examples are historical and shown only to illustrate a calculation. Past performance does not indicate future results. Please do your own research or consult a registered adviser before making investment decisions. See the privacy & disclaimer policy for more.