
Technical Analysis — Zero to Hero · Part 20 of 22
OBV and VWAP: two volume tools, and what daily data can't tell you
Two ways to use volume
The volume post made one point that matters here: every share bought was sold by someone, so volume measures participation, not “buying pressure”. Two popular tools try to squeeze more out of volume anyway:
- OBV (on-balance volume), usually credited to Joseph Granville, keeps a running total of volume, adding it on up days and subtracting it on down days.
- VWAP (volume-weighted average price) is the average price paid during a session, with each trade weighted by its size.
One of them can be tested on the daily data this blog has. The other, honestly, can’t. Being clear about which is which is half the lesson.
OBV: the formula
If Close(today) > Close(yesterday):  OBV = OBV(yesterday) + Volume(today)
If Close(today) < Close(yesterday):  OBV = OBV(yesterday) − Volume(today)
If unchanged:                        OBV = OBV(yesterday)

Start: OBV = 0 on the first day of the data
Notice what this does. A day that closed ₹0.05 higher adds its entire volume. A day that fell 6% subtracts its entire volume, no more than a day that fell 0.1%. The size of the price move doesn’t count at all, only its direction. And the starting point is whatever day your data happens to begin, so the level of OBV means nothing. Only its changes do.
🧒 Explain it like I'm 10 (optional — skip if this is already clear)
Imagine keeping score in a game with a big jar of marbles. Every day your team wins, you add as many marbles as there were people in the crowd. Every day you lose, you take that many out.
It doesn’t matter if you won by one goal or ten. It doesn’t matter if you lost by a whisker. Only “win or lose” and “how big was the crowd”.
So if one day a huge crowd turns up for a match that ends almost level, and you lose by the tiniest margin, your jar suddenly empties a lot. The jar isn’t lying, exactly. It’s just not measuring what you’d think.
OBV on Britannia
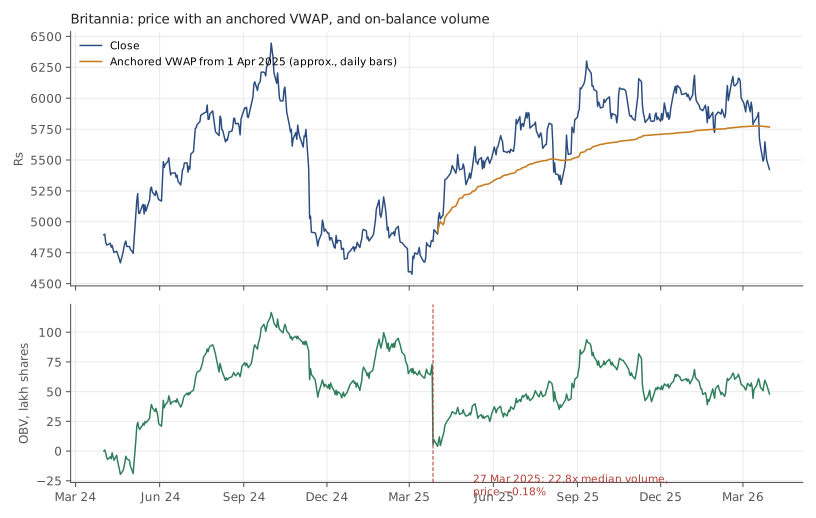
Britannia (NSE: BRITANNIA), daily bars, 1 April 2024 to 30 March 2026. Source: Yahoo Finance. Historical data, for illustration only.
Look at the lower panel. Most of the time OBV moves with price. Over any 20-session stretch, OBV and price moved in the same direction on 82% of the 475 days we could measure. That’s not surprising: OBV adds on up days and subtracts on down days, so it largely redraws the price chart with volume as the step size.
Then look at the dashed line: 27 March 2025. That day 67,50,074 shares traded, 22.8 times the median day’s volume, and the stock closed 0.18% lower. Barely a move. But because the close was a fraction lower, OBV subtracted all 67.5 lakh shares in one go. It was the biggest single-day step in the whole series. Whatever caused that volume, it didn’t show up as a price move. OBV reads it as heavy selling anyway, because the close happened to tick down.
The divergence test
OBV’s main selling point is divergence: price rises while OBV falls, so the rise “lacks volume support” and should fail. Or price falls while OBV rises, a “hidden accumulation” that should lead to a bounce.
We tested that on the fixed-horizon method from the backtesting post:
- Bearish divergence: price up over the last 20 sessions, OBV down over the same 20. Counted on the first day only.
- Bullish divergence: the reverse.
- Outcome: the return over the next 20 sessions, against the same return on every day.
| After… | Events | Average 20-session return | Median | Share positive |
|---|---|---|---|---|
| Bearish divergence (the “warning”) | 13 | 2.28% | 2.54% | 69.2% |
| Bullish divergence | 13 | 0.99% | 1.72% | 61.5% |
| Any day (base rate) | 455 | 0.73% | 1.2% | 58.7% |
One bearish and one bullish divergence were too close to the end of the data to score.
The “warning” was followed by better than average returns in this sample. The bullish divergence was followed by roughly average ones. With 13 events each on one stock, this doesn’t show that bearish divergence is secretly bullish. It shows that on this chart the signal didn’t do what its name says. It also fits the day above: an indicator that can drop by 67.5 lakh shares on a flat close will “diverge” from price for reasons that have nothing to do with anyone’s conviction.
VWAP: the formula
VWAP = Σ (price of each trade × shares in that trade)
       ÷ Σ (shares in each trade)

summed over every trade from the start of the session (or from a chosen
"anchor" point) to now
Here it is on a hypothetical session: five made-up trades in a ₹5,000 stock, not market data.
| Time | Price (₹) | Shares | Price × shares (₹) |
|---|---|---|---|
| 9:15 am | 5,000 | 400 | 20,00,000 |
| 10:30 am | 5,020 | 150 | 7,53,000 |
| 11:45 am | 4,990 | 900 | 44,91,000 |
| 1:30 pm | 5,040 | 100 | 5,04,000 |
| 3:15 pm | 5,030 | 450 | 22,63,500 |
| Total | 2,000 | 1,00,11,500 |
VWAP = ₹1,00,11,500 ÷ 2,000 = ₹5,005.75. The simple average of the five prices is ₹5,016. VWAP is lower because the biggest trade, 900 shares, happened at the lowest price. That’s the point: VWAP is what the typical share changed hands at, not the typical trade.
Why this blog can’t show you a real VWAP
VWAP needs every trade in the day, or at least minute-by-minute prices and volumes. This blog’s data is one bar per day: open, high, low, close, total volume. You can’t recover a true intraday VWAP from that, and a post that pretended to would be inventing numbers.
What you can do with daily bars is approximate a multi-day, anchored VWAP, using each day’s “typical price” (high + low + close) ÷ 3 as a stand-in for that day’s average trade. The chart above does this from 1 April 2025, the first session of FY 2025-26. By 30 March 2026 the approximation stood at ₹5,766.4, against a simple average close of ₹5,779 over the same 247 sessions. Treat it as a rough picture of the average price paid since the anchor, and nothing more. Every “typical price” is a guess at where that day’s volume actually traded.
So what is real VWAP used for? Mostly as a benchmark for execution. A fund buying a large block over a day can compare its average fill with the day’s VWAP to judge whether it traded well. It’s a yardstick for the trader’s own fills, not a forecast.
You’ve also been looking at VWAP all along. SEBI’s circular of 16 January 2026 describes the closing price of stocks in the equity cash segment as the VWAP of trades in the last thirty minutes of continuous trading. That’s how every “close” in this dataset was set. The same circular scheduled a closing auction to replace that method for stocks with derivatives on them, starting 3 August 2026, with other stocks staying on the 30-minute VWAP. If you’re reading this later, check how the close is set today.
Doing it in Python
import numpy as np, pandas as pd

df = pd.read_csv("britannia-ohlcv-2024-04-to-2026-03.csv",
                 parse_dates=["date"]).set_index("date")

obv = (np.sign(df.close.diff()).fillna(0) * df.volume).cumsum()

p20, o20 = df.close.pct_change(20), obv.diff(20)
bear = (p20 > 0) & (o20 < 0)
first = bear & ~bear.shift(fill_value=False)       # first day of each episode
fwd = df.close.shift(-20) / df.close - 1
print("after bearish divergence:", fwd[first].dropna().mean().round(4),
      " any day:", fwd.iloc[20:].dropna().mean().round(4))

# anchored VWAP from daily bars — an APPROXIMATION (typical price, not trades)
seg = df.loc["2025-04-01":]
tp = (seg.high + seg.low + seg.close) / 3
avwap = (tp * seg.volume).cumsum() / seg.volume.cumsum()
print(avwap.iloc[-1].round(1))
Common mistakes
- Reading the OBV level. It depends entirely on where your data starts. Two charts of the same stock starting on different dates show different OBV numbers, and both are “right”.
- Reading volume as buying or selling. OBV labels a whole day’s volume “buying” or “selling” from one tick in the close. The day with 22.8 times normal volume and a flat price shows what that gets wrong.
- Calling a daily-bar calculation “VWAP”. Anything computed from daily bars is an approximation. Label it as one, and don’t compare it with a broker’s intraday VWAP as if they were the same number.
- Treating VWAP as support or resistance. VWAP describes the average price paid. Whether price “respects” it is a separate claim, and needs the same base-rate test as any other level.
Takeaway: OBV turns each day’s volume into a plus or a minus from one tick in the close, and on two years of Britannia its “warning” divergences were followed by better-than-average returns. VWAP is a genuinely useful benchmark for execution, but it needs intraday trades, and daily bars can only approximate it.
This post is for educational purposes only and is not investment advice. Wealth Primer explains concepts, not recommendations — nothing here is a suggestion to buy, sell, or hold any specific security or fund. The author is not a SEBI-registered Research Analyst or Investment Adviser. Any prices or figures used as worked examples are historical and shown only to illustrate a calculation. Past performance does not indicate future results. Please do your own research or consult a registered adviser before making investment decisions. See the privacy & disclaimer policy for more.