
Technical Analysis — Zero to Hero · Part 14 of 22
How to backtest an indicator honestly
The question the whole series has been avoiding
Every post in this series ended the same way: here is a signal that worked, here is the same signal that didn’t, and one chart cannot tell you which is typical. Fair enough. But the obvious follow-up is: so test it properly. Take the rule, run it over the whole history, count the rupees.
That is a backtest, and it is the right instinct. It is also the single easiest place in all of investing to fool yourself, because the mistakes don’t look like mistakes. They look like a strategy that works. This post runs three rules from earlier posts through a backtest, makes the classic errors on purpose, and shows what each one does to the answer.
The dataset is the same: Britannia (NSE: BRITANNIA), daily bars, 1 April 2024 to 30 March 2026. The backtest window is shorter — it starts on 21 January 2025, the first day a 200-day average exists — and runs 295 sessions to 30 March 2026, about 1.19 years. Every strategy and the benchmark are measured over that identical window with ₹1,00,000 to start.
The three rules
All three are long-only: either you hold the stock or you hold cash. No shorting, no leverage.
| Rule | In | Out |
|---|---|---|
| SMA 50/200 — the golden cross | 50-day average above 200-day | 50-day below 200-day |
| SMA 20/50 — the same idea, faster | 20-day above 50-day | 20-day below 50-day |
| RSI 30/70 — the textbook oscillator rule | RSI falls below 30 | RSI rises above 70 |
And the benchmark every rule has to beat: buy on day one, do nothing.
Mistake 1: trading at a price you couldn’t have had
The first backtest most people write computes today’s signal from today’s close and then buys at today’s close. It feels natural. It’s impossible. The close is the last price of the day; by the time you know it, the market is shut. The earliest you can act is tomorrow.
This is look-ahead bias: using information in the decision that wasn’t available when the decision had to be made. It’s the most common backtest error and, in more elaborate systems, the hardest to spot.
| Rule | Same-day close (look-ahead), a year | Next-day close (honest), a year |
|---|---|---|
| SMA 50/200 | −1.8% | −2.7% |
| SMA 20/50 | −24.1% | −24.6% |
| RSI 30/70 | 14.6% | 14.9% |
Annualised returns, no costs.
Here the gap is small — under a percentage point either way, and for the RSI rule the honest version actually did marginally better, which is just noise. That’s because these rules trade rarely and a one-day slip on a large-cap doesn’t move much. Don’t be reassured. For a rule that trades often, or on volatile stocks, the same one-day error can be big enough to turn a losing strategy into a “winning” one, and even in this dataset it’s worth 0.9 of a percentage point a year on the slow 50/200 rule. The fix is one line of code — shift the signal by a day — and there is no excuse for skipping it.
Mistake 2: forgetting that trading costs money
Every buy and every sell pays brokerage, STT (Securities Transaction Tax), exchange charges, GST and stamp duty, and loses a little to the bid–ask spread. Call it 0.1% per side here — illustrative, and on the low side for a retail account.
| Rule | Next-day, no costs | Next-day, with costs | Trades |
|---|---|---|---|
| SMA 50/200 | −2.7% | −2.8% | 1 |
| SMA 20/50 | −24.6% | −25.2% | 5 |
| RSI 30/70 | 14.9% | 14.5% | 3 |
Again modest, because these rules trade one to five times in a year. Scale the same 0.1% up to a rule that trades weekly and costs alone eat several percentage points annually — which is one reason the MACD post was so uneasy about a signal every fifteen sessions.
The honest scoreboard
Next-day execution, costs included, the same window for everyone:
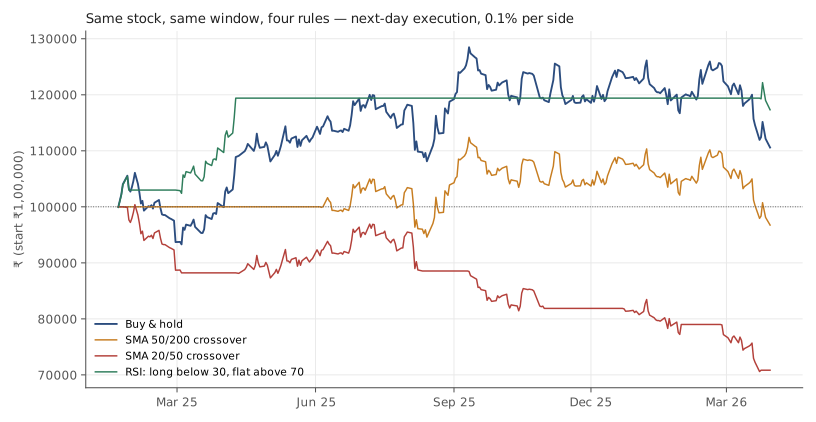
Britannia (NSE: BRITANNIA), daily bars, 21 January 2025 to 30 March 2026. Source: Yahoo Finance. Historical data, for illustration only.
| Item | Final value | Return a year | Worst drawdown | Trades | Time invested |
|---|---|---|---|---|---|
| Buy and hold | ₹1,10,587 | 8.9% | −13.9% | 1 | 100% |
| SMA 50/200 | ₹96,742 | −2.8% | −13.9% | 1 | 69.2% |
| SMA 20/50 | ₹70,832 | −25.2% | −29.7% | 5 | 63.1% |
| RSI 30/70 | ₹1,17,322 | 14.5% | −4.0% | 3 | 11.5% |
Trades counts entries into the stock. A rule that’s already holding the stock when the window opens counts that as its first trade.
Three things to take from this table, in order of how tempting they are to misread.
The 20/50 crossover lost a quarter of the money. Five trades, every one of them late into a move and late out of it — the whipsaw the moving-averages post warned about, in rupees. The 50/200 version did less damage only because it traded once: it bought after the June 2025 golden cross, sat through the subsequent decline, and finished below where it started while buy-and-hold finished up.
The RSI rule “won.” 14.5% a year against 8.9% for doing nothing, with a worst drawdown of only 4.0%. This is the row that gets screenshotted. Now look at the last two columns: 3 trades, invested 11.5% of the time. The rule sat in cash for seven-eighths of the period and happened to be in the stock during a few good weeks. Three trades is not a strategy; it’s three coin flips that landed well. The drawdown is small because there was almost no time for one to happen.
And one of those three trades wasn’t even taken inside the test. RSI went oversold on 23 December 2024, a month before the window opens, so the rule starts the window already holding the stock. Start it in cash like everything else and it returns 11.6% a year on 2 trades, invested 9.8% of the time — still ahead of buy-and-hold on paper, and still far too few trades to mean anything. A backtest’s start date is one more choice that can move the answer.
Buy-and-hold is the row to beat, and it’s harder than it looks. It paid one commission, was never out of the market, and took the full 13.9% drawdown. Every rule that “avoids” that drawdown has to avoid it and be back in for the recovery, and on this evidence, none of the moving-average rules managed it.
🧒 Explain it like I'm 10 (optional — skip if this is already clear)
Imagine a friend says they have a system for guessing which way a coin will land. You ask them to prove it, and they flip a coin three times, call it right twice, and say “see — 67% accuracy.”
Three flips proves nothing. You’d want to see hundreds. And you’d want to make sure they call it before the coin lands, not after — and that they don’t quietly stop counting the flips they got wrong.
A backtest is the same test for a trading rule. Most of the ways to cheat are accidental. This post is about spotting them.
Mistake 3: picking the parameters after you’ve seen the answer
Why 50 and 200? Why 20 and 50? Because they’re conventions. But the moment you ask “what if I tried 30 and 150?”, you’re on a slope that ends in overfitting — choosing the settings that happened to work on the data you already have, and mistaking that for a rule that works.
Here is every combination of a fast average from {10, 20, 30, 50} and a slow one from {50, 100, 150, 200}, honestly executed, costs included, same window:
| Fast \ Slow | 50 | 100 | 150 | 200 |
|---|---|---|---|---|
| 10 | −3.3% | +1.1% | +4.8% | +2.2% |
| 20 | −25.2% | −9.3% | −0.6% | +2.2% |
| 30 | −17.0% | −4.6% | +1.0% | −1.3% |
| 50 | — | +7.3% | +1.2% | −2.8% |
Annualised return. Buy-and-hold over the same window: 8.9%.
The spread between the best pair (50/100, 7.3%) and the worst (20/50, −25.2%) is 32.5 percentage points a year — on the same stock, over the same fourteen months, from the same idea. The only thing that changed was two numbers chosen by the person running the test.
And the line that matters most: 0 of the 15 pairs beat buy-and-hold. Not the conventional ones, not the optimised ones. If you had searched this grid, found 50/100, and published it as “the setting that works for Britannia”, you would have been reporting the least-bad loser.
The general lesson: if a rule only works for specific parameter values and falls apart for neighbouring ones, it isn’t a rule. It’s a description of one dataset’s noise.
What an honest backtest needs, and this one doesn’t have
Even with look-ahead removed, costs added and parameters held fixed, this test is nowhere near sufficient evidence for or against any of these rules. Being clear about why is the point of the exercise:
- One stock. A rule has to be tested on many, ideally chosen before looking at which ones it worked on.
- 1.19 years. Across a single market regime. The 50/200 cross earned its reputation over decades and many markets; a year of one company says nothing either way.
- A handful of trades. Three trades, five trades, one trade. No statistical claim survives sample sizes like that.
- No out-of-sample test. Every parameter was evaluated on the same data it would be “chosen” from. The minimum honest procedure is to pick settings on one period and test them on another you haven’t looked at.
- Survivorship. Britannia is in this dataset because it’s a large, long-lived company. A rule tested only on the companies that survived to be tested is flattered by construction.
- Slippage and fills. The test assumes you got the next day’s close. Real fills are worse in exactly the fast markets where these rules trigger.
None of these are fixable in a blog post. They are fixable in a serious research process, and when people have done that work at scale, the results have been modest. Park and Irwin’s 2007 survey (Journal of Economic Surveys) found that many studies reporting profitable technical rules were weakened by data snooping, rules picked after the fact, or understated costs. Sullivan, Timmermann and White (1999) found that the best moving-average rules from a century of Dow Jones data stopped working in the decade that followed. In our reading, simple trend rules have shown uneven, cost-sensitive edges in some markets and periods — nothing like the reliability the tutorials imply. Which is roughly what the limitations post said before running a single test.
Doing it in Python
The entire honest backtest is about fifteen lines. The two that matter are marked.
import pandas as pd

df = pd.read_csv("britannia-ohlcv-2024-04-to-2026-03.csv",
                 parse_dates=["date"]).set_index("date")

signal = (df.close.rolling(50).mean() > df.close.rolling(200).mean()).astype(int)

pos = signal.shift(1).fillna(0)          # (1) act on TOMORROW's close, not today's
ret = df.close.pct_change().fillna(0)
cost = pos.diff().abs().fillna(0) * 0.001  # (2) pay 0.1% every time position changes

strat = pos.shift(1).fillna(0) * ret - cost
equity = 100000 * (1 + strat).cumprod()
bench  = 100000 * (1 + ret).cumprod()

start = df.index[200]                      # compare over the same window
for name, eq in [("rule", equity), ("buy & hold", bench)]:
    eq = eq[start:] / eq[start] * 100000
    dd = (eq / eq.cummax() - 1).min() * 100
    print(f"{name:11s} final ₹{eq.iloc[-1]:,.0f}  worst drawdown {dd:.1f}%")
Replace line (1) with pos = signal and you have a look-ahead backtest. Delete line (2) and you
have a free-trading one. Both will look better than this. Neither is real.
Common mistakes
- Computing the signal and the trade from the same bar. Look-ahead bias. Shift the signal.
- Testing without costs. Costs are the one part of the result you know in advance. Leaving them out is choosing to be wrong by a known amount.
- Searching parameters and reporting the best. That’s the answer to “what worked?”, not “what works?”. Fifteen pairs, zero beat the benchmark, and one of them would still have looked publishable.
- Comparing against nothing. Every rule here has to beat doing nothing, and doing nothing is a surprisingly strong opponent.
- Trusting a small drawdown from a rule that’s rarely invested. Sitting in cash 88.5% of the time is why the RSI rule’s drawdown is small. That’s not risk control; it’s absence.
- Concluding anything from one stock and fourteen months. Including the conclusion that these rules don’t work. This test can’t show that either.
Takeaway: A backtest is the right idea and the easiest place in investing to fool yourself. On one stock and fourteen months, look-ahead bias and costs each moved the answer by under a point, but choosing the moving-average lengths after the fact moved it by 32.5 points a year — and none of the fifteen pairs beat simply holding, while the rule that “won” traded three times. Shift your signal by a day, pay your costs, fix your parameters before you look, and then remember that even a clean test on one chart proves almost nothing.
This post is for educational purposes only and is not investment advice. Wealth Primer explains concepts, not recommendations — nothing here is a suggestion to buy, sell, or hold any specific security or fund. The author is not a SEBI-registered Research Analyst or Investment Adviser. Any prices or figures used as worked examples are historical and shown only to illustrate a calculation. Past performance does not indicate future results. Please do your own research or consult a registered adviser before making investment decisions. See the privacy & disclaimer policy for more.