
Technical Analysis — Zero to Hero · Part 13 of 22
Multiple timeframes: the weekly chart is not a second opinion
The recipe everyone is taught
Somewhere in every technical-analysis course is the same advice: trade in the direction of the higher timeframe. Find the trend on the weekly chart, then use the daily chart to time your entry. A daily “oversold” reading inside a weekly uptrend is a dip worth buying; the same reading inside a weekly downtrend is a falling knife.
It’s sensible-sounding advice, and it contains a real idea — a signal means different things in different contexts. It also has a problem that the tutorials never show you, because they never run the numbers. This post does.
Same data as the whole series: Britannia (NSE: BRITANNIA), daily bars, 1 April 2024 to 30 March 2026, resampled to weekly bars — 105 of them.
What “resampling” means
A weekly bar is built from that week’s daily bars (usually five):
Weekly open   = open of the week's first session
Weekly high   = highest high of the week
Weekly low    = lowest low of the week
Weekly close  = close of the week's last session
Weekly volume = sum of the week's sessions
Nothing new is added. The weekly chart contains strictly less information than the daily one — it’s the same data with four-fifths of the detail thrown away. That’s the point: less detail, less noise, and a trend that’s easier to see. It’s the moving-average trade-off again in a different costume: smoother, but later.
🧒 Explain it like I'm 10 (optional — skip if this is already clear)
Imagine your temperature is taken every hour for a month. The hourly chart is a mess — you’re warmer after lunch, cooler at night.
Now take just one reading a day. The chart is much smoother, and if you’re slowly getting a fever, you’ll see it clearly.
But here’s the catch: if you started getting a fever this afternoon, the daily chart won’t show it until tomorrow. The smoother chart is the slower chart. That’s not a flaw you can fix — it’s what smoothing is.
The chart
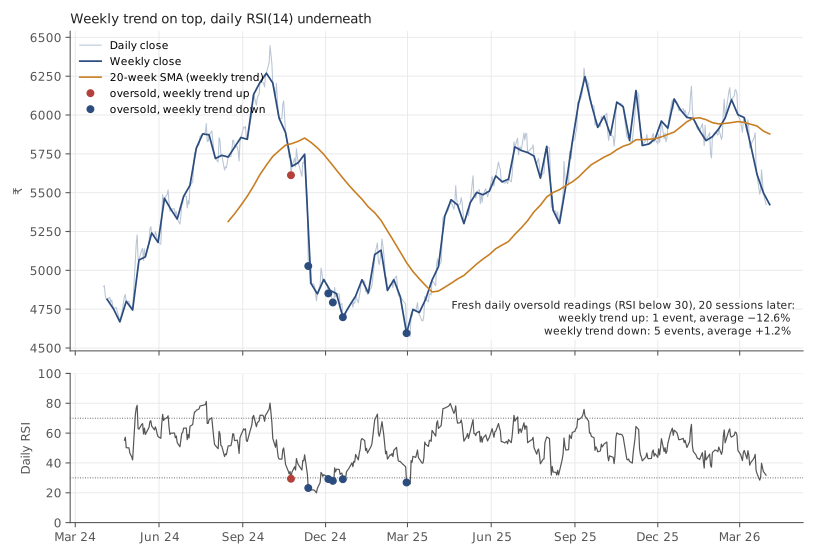
Britannia (NSE: BRITANNIA), daily bars, 1 April 2024 to 30 March 2026, with weekly bars built from them. Source: Yahoo Finance. Historical data, for illustration only.
Top: weekly closes with a 20-week simple moving average (roughly 100 trading days) as the “weekly trend” — up when the weekly close is above it, down when below. Bottom: the daily 14-period RSI. The weekly average needs 20 weeks of history, so the trend reading begins on 16 August 2024; before that there is no weekly trend to speak of.
Over the period where it exists, the weekly trend read “up” for 49 weeks and “down” for 37.
Every daily oversold reading, sorted by the weekly trend
Here is the test the tutorials skip. Take every day on which the daily RSI first dropped below 30 — a fresh “oversold” reading — and record what the weekly trend said as of the previous completed week (so no peeking at a week that hadn’t finished). Then look 20 sessions ahead.
There were 8 fresh oversold readings in two years, but not all of them can be scored. The one on 18 April 2024 came before any weekly trend existed (and inside the RSI’s own warmup). The one on 23 March 2026 is too close to the end of the data to have 20 sessions after it. That leaves 6:
| Date | Daily RSI | Close | Weekly trend | 20 sessions later | Lowest low in between |
|---|---|---|---|---|---|
| 2024-10-24 | 29.4 | ₹5,612.4 | up | −12.6% | ₹4,746.9 |
| 2024-11-12 | 23.2 | ₹5,027.6 | down | −4.0% | ₹4,746.9 |
| 2024-12-04 | 29.2 | ₹4,851.6 | down | −1.3% | ₹4,663.8 |
| 2024-12-09 | 28.0 | ₹4,793 | down | +0.8% | ₹4,663.8 |
| 2024-12-20 | 29.1 | ₹4,698.1 | down | +4.0% | ₹4,663.8 |
| 2025-02-28 | 26.9 | ₹4,595.4 | down | +6.6% | ₹4,506 |
Summarised:
| Weekly trend at the time | Events | Average 20-session return | Share positive |
|---|---|---|---|
| Up (“buy the dip”) | 1 | −12.6% | 0% |
| Down (“falling knife”) | 5 | +1.2% | 60% |
The recipe says the top row should be the good one. In this dataset it is the only losing row.
Why the “uptrend” dip was the worst one
The single oversold reading inside a weekly uptrend came on 24 October 2024, with RSI at 29.4 and the stock at ₹5,612.4. Twenty sessions later it was 12.6% lower, and the lowest low along the way was ₹4,746.9.
Look at where that date sits: three weeks after the 3 October 2024 peak that the trend lines post built its examples on. The stock had already turned. The daily chart knew it — that’s why RSI was under 30. The weekly chart did not know it yet, because a 20-week average takes weeks to roll over after a top. The “higher timeframe uptrend” was a lagging description of a rally that had ended.
This is the structural problem with the recipe, and it isn’t specific to this stock. The higher timeframe is smoother because it is slower. So at exactly the moment it matters most — right after a top or a bottom — the weekly trend is the last thing to notice. The daily signal fires; the weekly context says “still fine”; the recipe says buy.
The two downtrend examples
The mirror image is in the bottom row. Of the five oversold readings inside a weekly downtrend — the ones the recipe says to ignore — three were followed by gains.
On 12 November 2024, the reading behaved as advertised: RSI 23.2, weekly trend down, and the stock fell another 4.0% over the next 20 sessions. The RSI post used this exact date as its “oversold but kept falling” example.
On 28 February 2025, the opposite: RSI 26.9, weekly trend firmly down, four sessions before the 4 March 2025 low that ended the whole decline — and the stock rose +6.6% over the next 20 sessions. The weekly trend was still “down” for weeks afterwards, for the same lag reason: it took that long for the average to catch up with the turn.
Same signal, same weekly context, opposite outcomes. Three months apart, on the same stock.
What multiple timeframes are actually good for
None of this means the weekly chart is useless. It means the weekly chart is a description of the recent past at a coarser resolution — not an independent second opinion, and certainly not a filter that makes daily signals reliable. Used honestly, it does two things well:
- It stops you mistaking noise for structure. The chart-patterns post found six swing highs in a 3% band that a daily chart could be talked into calling a double top. On the weekly chart they collapse into one flat ceiling — the more accurate reading.
- It sets the scale for everything else. Where the support and resistance zones come from, how far an ATR-based stop should sit — these depend on the timeframe you’re actually operating on, and looking at one chart above yours keeps that honest.
What it can’t do is turn a signal that’s unreliable on the daily chart into a reliable one. Agreement between timeframes feels like confirmation. Since the weekly is built from the daily, it’s closer to hearing the same thing twice.
Doing it in Python
import pandas as pd

df = pd.read_csv("britannia-ohlcv-2024-04-to-2026-03.csv",
                 parse_dates=["date"]).set_index("date")

# daily -> weekly bars (weeks ending Friday)
wk = df.resample("W-FRI").agg({"open": "first", "high": "max",
                               "low": "min", "close": "last",
                               "volume": "sum"}).dropna()
ma = wk.close.rolling(20).mean()
wk["trend_up"] = (wk.close > ma).where(ma.notna())   # no trend until the average exists

# weekly trend as known on each DAILY bar: use the PREVIOUS completed week
trend_on_day = wk.trend_up.shift(1).reindex(df.index, method="ffill")

delta = df.close.diff()
rsi = 100 - 100 / (1 + delta.clip(lower=0).ewm(alpha=1/14, adjust=False).mean()
                   / (-delta.clip(upper=0)).ewm(alpha=1/14, adjust=False).mean())
oversold = (rsi < 30) & (rsi.shift() >= 30)          # first day of each episode
fwd = df.close.shift(-20) / df.close - 1

# events with no weekly trend yet, or no 20 sessions after, drop out here
print(pd.DataFrame({"weekly_up": trend_on_day, "fwd20": fwd})[oversold]
        .groupby("weekly_up").fwd20.agg(["count", "mean"]).round(3))
The .shift(1) on the weekly trend is the line that keeps this honest. Without
it, a Wednesday’s signal would be judged against a weekly bar that includes
Thursday and Friday — prices that hadn’t happened yet. The next post is
entirely about that kind of mistake.
Common mistakes
- Treating the higher timeframe as an independent opinion. It’s the same prices, aggregated. Agreement is not confirmation.
- Forgetting that smoother means slower. The weekly trend is last to turn at tops and bottoms — precisely when a daily signal is most tempting.
- Judging a daily signal against the current, unfinished week. That week’s close is in the future. Use the last completed bar.
- Adding timeframes until they agree. With daily, weekly, monthly and four-hourly charts to choose from, some pair will always line up. That’s a search, not a signal.
- Quoting a weekly average before it exists. Twenty weeks of history means twenty weeks of nothing. The first trend reading here is 16 August 2024, four and a half months into the data.
Takeaway: A weekly chart is the daily chart with the detail thrown away — smoother, and therefore slower — not an independent second opinion. On two years of Britannia, the only daily oversold reading that arrived inside a weekly “uptrend” was followed by a 12.6% fall, because the weekly trend hadn’t yet noticed the top, while three of the five readings in a weekly “downtrend” were followed by gains. Use the higher timeframe to set scale and kill noise, not to launder a daily signal.
This post is for educational purposes only and is not investment advice. Wealth Primer explains concepts, not recommendations — nothing here is a suggestion to buy, sell, or hold any specific security or fund. The author is not a SEBI-registered Research Analyst or Investment Adviser. Any prices or figures used as worked examples are historical and shown only to illustrate a calculation. Past performance does not indicate future results. Please do your own research or consult a registered adviser before making investment decisions. See the privacy & disclaimer policy for more.