
Technical Analysis — Zero to Hero · Part 12 of 22
Relative strength vs the index: the other RS, and the one that means what it says
Two things called RS, one of them misnamed
The RSI post flagged this in passing: the Relative Strength Index has nothing to do with strength relative to anything. It compares a stock only to its own recent behaviour.
This post is about the other one — plain relative strength, sometimes written RS or “comparative relative strength” to keep it apart from RSI. This one means exactly what it says: is the stock doing better or worse than the market it trades in?
It’s a simple idea, it’s badly under-used compared with RSI, and it answers a question every long-term holder eventually asks: my stock is up, but is that me or is that just the market?
The formula
Relative strength = Stock price / Index level

Rebased:  RS(t) = ( Stock(t) / Index(t) ) ÷ ( Stock(0) / Index(0) ) × 100
The rebasing just sets the ratio to 100 on the first day so it reads like a percentage: 110 means the stock has beaten the index by 10% since the start; 90 means it has lagged by 10%.
Three things about the ratio are worth spelling out:
- It rises when the stock outperforms — even if both are falling. A stock down 5% while the index is down 15% has rising relative strength. That is the whole point and also the main way people misread it.
- The absolute level is arbitrary, because it depends on the rebasing date. Only the direction and the changes mean anything.
- It is a ratio of two noisy series, so it is itself noisy. People put a moving average on it for the same reason they put one on price.
🧒 Explain it like I'm 10 (optional — skip if this is already clear)
Your class sits an exam. You scored 65, up from 60 last time — good news?
Depends. If the whole class averaged 80 this time, up from 55, you actually did worse compared with everyone else, even though your own score went up. If the class average fell to 40, your 65 is spectacular.
Relative strength is your score divided by the class average. It tells you whether you’re pulling ahead of the room or falling behind it — separately from whether your own score went up or down.
The chart
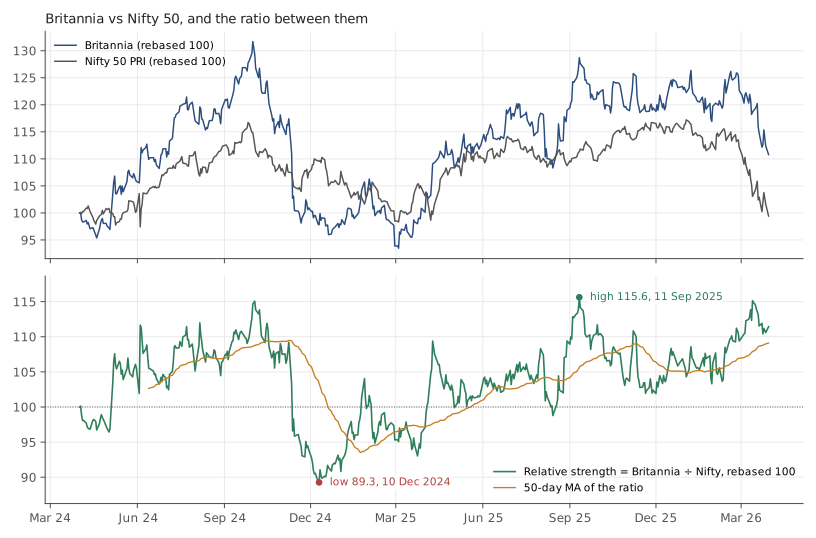
Britannia (NSE: BRITANNIA) and the Nifty 50 price index, daily, 1 April 2024 to 30 March 2026 (494 common sessions). Sources: Yahoo Finance, BRITANNIA.NS and Yahoo Finance, ^NSEI. Historical data, for illustration only.
The top panel shows both rebased to 100. The bottom panel is the ratio, with its 50-day moving average.
| Item | |
|---|---|
| Britannia, price return over the window (no dividends) | 10.8% |
| Nifty 50 price index, price return (no dividends) | −0.6% |
| Difference | 11.4 percentage points |
| Relative strength at the start | 100.0 |
| Relative strength at the end | 111.4 |
| Lowest | 89.3 on 2024-12-10 |
| Highest | 115.6 on 2025-09-11 |
Over two years the stock beat the index by about eleven points. But the path matters more than the endpoint. The ratio rose for the first six months, to about 115 in early October 2024. Then it collapsed in just two, to 89.3 in December 2024. Then it spent the next nine months climbing back to 115.6 — barely above where it had been a year earlier. Someone who looked only in October 2024 would have called this a market leader. Someone who looked only in December 2024 would have called it a laggard. Someone who looked in September 2025 would have called it a leader again. All three would have been describing the same two years.
Note that both sides are price-only: the Britannia figure leaves out its dividends, and the Nifty figure is the price index, which leaves out the index’s. The benchmarks post explained how comparing a total return against a price index flatters the total return by roughly the dividend yield. That problem doesn’t arise here, because like is compared with like. What the ratio does miss is any gap between Britannia’s dividend yield and the index’s — small over two years, and it doesn’t change the shape of the ratio.
The part the ratio hides
Here is where relative strength earns its keep, and also where it misleads if you stop reading too early.
The trend lines post built its examples on Britannia’s five-month slide from its 3 October 2024 peak to the 4 March 2025 trough. Over that same window:
| 3 October 2024 → 4 March 2025 | Change |
|---|---|
| Britannia | −27.7% |
| Nifty 50 | −12.5% |
The index fell too. Roughly half of Britannia’s decline was the market, not the stock — which the price chart alone can’t tell you, and which the ratio shows immediately. That is the constructive use of relative strength: separating what the company did from what the market did.
It also shows the trap. During the worst stretch of that decline the ratio was falling — Britannia was underperforming a falling market — and an investor reading “weak relative strength” as a signal would have been right about direction but for reasons that had nothing to do with the ratio. The ratio describes; it doesn’t forecast.
Relative strength and the moving average
Putting a 50-day average on the ratio and asking “is RS above or below its average?” is the standard way people turn this into a trend reading. In this dataset RS sat above its average 64.5% of the time. The longest stretch below was 56 sessions (about eleven weeks); the longest above was 49.
The best 60-session stretch of relative performance was +12.7% ending 23 July 2024; the worst was −19.8% ending 2 January 2025. Those are big swings for a large, stable consumer company against its own index — a reminder that “relative strength” is not a stable property of a stock but a description of a particular window.
Why this matters beyond charts
Relative strength is one of the few technical ideas with a direct line to the fundamental side of this blog. If a company’s relative strength has been falling for a year while its ROCE and free cash flow are unchanged, the market may have re-rated it — its P/E has compressed — or the rest of the market may have been re-rated upwards, or the index’s earnings may simply have grown faster than the company’s. All three are worth knowing. None is visible on a price chart alone. (For the portfolio version of the same question — how much of a return was simply the market’s — see beta and alpha.)
Doing it in Python
import pandas as pd

stock = pd.read_csv("britannia-ohlcv-2024-04-to-2026-03.csv",
                    parse_dates=["date"]).set_index("date").close
nifty = pd.read_csv("nifty50-price-index.csv",
                    parse_dates=["date"]).set_index("date").nifty50_pri_close

both = pd.concat([stock.rename("stock"), nifty.rename("nifty")], axis=1).dropna()
rs = both.stock / both.nifty
rs = rs / rs.iloc[0] * 100                 # rebase to 100 on day one
rs_ma = rs.rolling(50).mean()

print(f"RS end {rs.iloc[-1]:.1f}  low {rs.min():.1f} on {rs.idxmin().date()}  "
      f"high {rs.max():.1f} on {rs.idxmax().date()}")
above = (rs > rs_ma)[rs_ma.notna()]        # skip the 50-day warmup
print(f"above its 50-day MA {above.mean()*100:.1f}% of the time")
The .dropna() after the concat matters: the two series have slightly
different trading calendars (the index file has a few dates the stock file
doesn’t, and vice versa), and a ratio on a day where one side is missing is
garbage.
Common mistakes
- Confusing it with RSI. RSI is a 0–100 oscillator about a stock’s own momentum. Relative strength is an unbounded ratio against a benchmark. Same letters, unrelated tools.
- Reading rising RS as “the stock is going up.” It means the stock is beating the index. Both can be falling.
- Comparing against the wrong index. A mid-cap against the Nifty 50, or a bank against a consumer index, produces a ratio that mostly measures the sector gap. Compare like with like.
- Treating the level as meaningful. 111 means nothing on its own; it depends entirely on where you started the clock. Only the slope matters.
- Assuming it persists. Two years contained an eleven-week stretch of underperformance and a nine-month stretch of outperformance on the same stock. Relative strength is a description of a window, not a trait.
Takeaway: Relative strength — the stock divided by its index — separates what a company did from what the market did, which is the one question a price chart can’t answer on its own. Over two years Britannia beat the Nifty by about eleven points, but the ratio rose for six months, collapsed over two, then climbed for nine, and half of the stock’s worst decline turned out to be the market’s. Read it as a description, never a forecast.
This post is for educational purposes only and is not investment advice. Wealth Primer explains concepts, not recommendations — nothing here is a suggestion to buy, sell, or hold any specific security or fund. The author is not a SEBI-registered Research Analyst or Investment Adviser. Any prices or figures used as worked examples are historical and shown only to illustrate a calculation. Past performance does not indicate future results. Please do your own research or consult a registered adviser before making investment decisions. See the privacy & disclaimer policy for more.