
Technical Analysis — Zero to Hero · Part 9 of 22
Chart patterns: the double top that wasn't
Shapes with names
Chart patterns are the most recognisable part of technical analysis and the part most deserving of scepticism. The claim is that price traces out recurring formations — shapes produced by the same crowd behaviour playing out again — and that each shape carries an expectation about what follows.
The vocabulary is worth knowing, if only because it’s everywhere:
| Pattern | Shape | Conventional reading |
|---|---|---|
| Double top | Two peaks at a similar level, a trough between | Reversal downward |
| Double bottom | Two troughs at a similar level | Reversal upward |
| Head and shoulders | Three peaks, the middle one highest | Reversal downward |
| Triangle | Converging highs and lows | Continuation, usually |
| Flag | A sharp move, then a tight drift against it | Continuation |
| Cup and handle | Rounded bottom, then a small dip | Continuation upward |
Each comes with a measured move — a target derived from the pattern’s own height. For a double top: measure from the peaks down to the trough (the “neckline”), then project that same distance below the neckline.
That’s the textbook. Now let’s try to apply it to real data, and watch what happens.
A textbook double top
Britannia in late 2025 offers what looks like a beautiful example:
- A peak on 10 November 2025 at ₹6,261.5
- A trough between them at ₹5,723
- A second peak on 7 January 2026 at ₹6,271
The two peaks are 0.15% apart — ₹9.50 on a ₹6,270 stock — separated by about two months. If you were looking for a double top, you could hardly ask for a cleaner one. The measured move projects to ₹5,175.
And the direction was right. From the second peak’s high of ₹6,271, the stock fell to a close of ₹5,423 on 30 March 2026 — a decline of 13.5%.
A post that stopped here would be a good advertisement for chart patterns. So let’s not stop here.
The same chart, with nothing left out
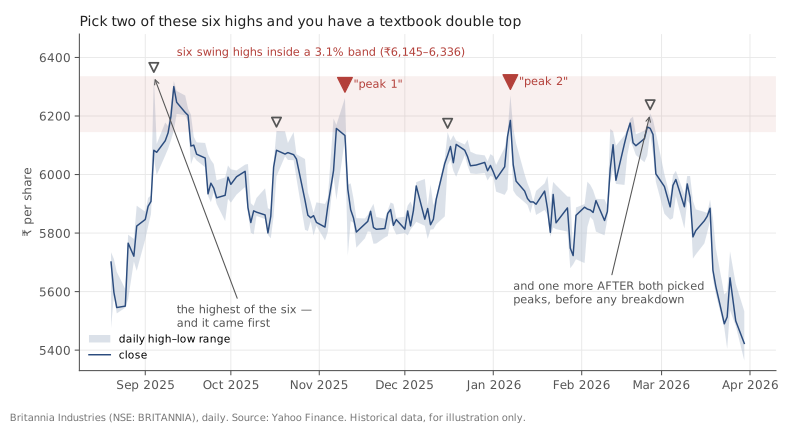
Britannia (NSE: BRITANNIA), daily, late August 2025 to March 2026. Source: Yahoo Finance. Historical data, for illustration only.
Those two peaks were not the only peaks. Here is every swing high in that stretch:
| Date | High | Item |
|---|---|---|
| 2025-09-04 | ₹6,336 | |
| 2025-10-17 | ₹6,149 | |
| 2025-11-10 | ₹6,261.5 | ← picked as “peak 1” |
| 2025-12-16 | ₹6,145 | |
| 2026-01-07 | ₹6,271 | ← picked as “peak 2” |
| 2026-02-25 | ₹6,208.5 |
Six swing highs, all inside a band of ₹6,145 to ₹6,336 — a range of just 3.1%.
And two details ruin the story completely:
The highest of the six came first. The peak on 4 September 2025, at ₹6,336, is higher than both of the peaks in the “double top” — and it happened before both of them. A genuine double top is a reversal formation at the end of an advance. This one has a taller peak sitting behind it.
Another peak came before the pattern ever confirmed. A double top only counts once price closes below the neckline (₹5,723), and that didn’t happen until 19 March 2026. On 25 February 2026, seven weeks after “peak 2,” price went back up to ₹6,208.5 — right back into the band. So for more than two months after the second peak, this was still just a range, not a completed pattern.
Read without the pattern imposed on it, this isn’t a double top at all. It’s a range: a stock oscillating underneath the resistance zone established back in 2024, bouncing off it six times over seven months. The “double top” only exists if you select two of the six highs and quietly discard the other four.
And the target was never reached
One more thing, since we’re being complete. The measured move projected ₹5,175. The lowest the stock actually traded was ₹5,364.5, on the final day of the dataset. The target was not reached.
So even granting the pattern, the specific quantitative prediction it makes — the one thing about it that’s testable — did not come true within the available data.
Why patterns are so persuasive
None of this means every chart pattern is imaginary. It means pattern recognition runs into three well-documented problems that its practitioners must actively work against.
We are built to find patterns. Humans see faces in clouds and shapes in noise. Given a squiggly line and a catalogue of formations, we will find matches. This is not a character flaw, it’s perception working as designed — which is exactly why it needs a check.
Patterns are identified after they complete. A double top isn’t a double top until price falls away from the second peak. Before that, it’s two highs and no information. Every gallery of beautiful examples is a gallery of completed ones — the ones that didn’t complete were never labelled and never collected.
The definitions are elastic. How close must the peaks be — 0.15%, 1%, 3%? How long between them? How deep must the trough be? Every one of those is a judgement, and each one is a degree of freedom you can unconsciously tune until a pattern appears.
Doing it in Python
The instructive exercise isn’t detecting a pattern — it’s counting what you’d have to ignore:
import pandas as pd

df = pd.read_csv("britannia-ohlcv-2024-04-to-2026-03.csv",
                 parse_dates=["date"]).set_index("date")

seg = df.loc["2025-08-20":]
w = 8
highs = seg.high[seg.high == seg.high.rolling(2*w+1, center=True).max()]

print(highs.round(1))
print(f"{len(highs)} swing highs, "
      f"range {highs.min():.0f}-{highs.max():.0f} "
      f"({100*(highs.max()/highs.min()-1):.1f}% wide)")
Before accepting any pattern, run this. If your two chosen points are two of six near-identical points, you don’t have a pattern — you have a range and a preference.
Common mistakes
- Selecting the points that fit and ignoring the rest. The mistake this entire post is about. Always enumerate every swing point in the window first, then see whether your pattern survives.
- Identifying patterns only in hindsight. If you can’t state in advance what would disconfirm the pattern, you’re describing history.
- Loosening the definition until something matches. Elastic criteria will always find a match. Fix the criteria first.
- Ignoring the base rate. Knowing a pattern “worked” tells you nothing without knowing how often the same shape appeared and nothing followed. Those cases don’t get written up.
- Treating the measured move as a forecast. Here it projected ₹5,175 and price never got there.
- Forgetting the pattern needs a trend to reverse. A reversal pattern in the middle of a range isn’t reversing anything.
Takeaway: Chart patterns are a vocabulary for describing shapes in price, and the shapes are real enough — but so is our talent for finding them. What looked like a textbook double top here was six swing highs in a 3% band, with the tallest one before both chosen peaks and another one after them, before the pattern had even confirmed. Enumerate every point before you name a pattern; if the name only survives by leaving points out, it was never there.
This post is for educational purposes only and is not investment advice. Wealth Primer explains concepts, not recommendations — nothing here is a suggestion to buy, sell, or hold any specific security or fund. The author is not a SEBI-registered Research Analyst or Investment Adviser. Any prices or figures used as worked examples are historical and shown only to illustrate a calculation. Past performance does not indicate future results. Please do your own research or consult a registered adviser before making investment decisions. See the privacy & disclaimer policy for more.