
Technical Analysis — Zero to Hero · Part 15 of 22
Gaps: the hole in the chart, and whether it really gets filled
A new kind of post
The backtesting post ended with a set of rules: fix the horizon before you look, pay your costs, and always compare against a base rate. This post, and the ones after it, take popular chart ideas and put them through exactly that. Each one explains the idea first, then tests it on data already on this blog, and reports what came out — including the parts that don’t flatter the idea.
We start with one of the oldest lines in charting: gaps get filled.
What a gap is
Stocks don’t trade overnight. News does. When something happens between one day’s close and the next day’s open — results, a policy change, a global sell-off — the first trade of the new day can happen well away from where the last one did. On a candlestick chart that shows up as a visible hole between two bars. That hole is a gap.
- Gap up: today’s open is above yesterday’s high. Nothing traded in between.
- Gap down: today’s open is below yesterday’s low.
Some people count any open above the previous close as a gap. We use the stricter, chart-visible version: an open beyond the previous high or low. We chose it before running anything, because it’s the gap you can actually see.
A gap is filled when price later trades back to where it was before the gap — the previous day’s close. The folklore says this nearly always happens.
The formula
Gap up:    Open(today) > High(yesterday)
Gap down:  Open(today) < Low(yesterday)

Gap size   = Open(today) / Close(yesterday) − 1

Filled within N sessions (gap up):
           the lowest Low from today to N−1 sessions later ≤ Close(yesterday)
Filled within N sessions (gap down):
           the highest High over the same sessions ≥ Close(yesterday)
“Within 1 session” means filled on the gap day itself.
🧒 Explain it like I'm 10 (optional — skip if this is already clear)
Imagine a ball bouncing along a pavement. Most of the time each bounce lands close to the last one. Once in a while a gust of wind carries it a bit further and there’s a gap between bounces.
“Gaps get filled” is like saying the ball will bounce back over that spot later. It usually does. But a ball that bounces around a lot passes over nearly every nearby spot sooner or later. So the real question isn’t “does it come back?” It’s “does it come back more often than it would to any spot that far away?”
The test, and the base rate nobody shows you
Here’s the trap. Most gaps are small. And a stock that moves around a lot revisits prices close to where it is all the time. So “the gap got filled” could be true almost every time without meaning anything about gaps.
The honest comparison is a base rate: take every session, not just gap days, and ask how often price came back the same distance from its open within the same window. If a gap up opened 0.6% above yesterday’s close, the base rate asks: on an ordinary day, how often does price trade 0.6% below where it opened, within the same number of sessions? If gaps fill more often than that, there’s something about gaps. If not, the folklore is just describing how prices wander.
The data is Britannia (NSE: BRITANNIA), daily bars, 1 April 2024 to 30 March 2026, from Yahoo Finance, which the whole series has used. It ends 30 March 2026, more than six months before this post. The Nifty file on this blog only has closing prices, so it can’t show gaps at all. That’s why this test runs on one stock rather than the index, which is a real limitation.
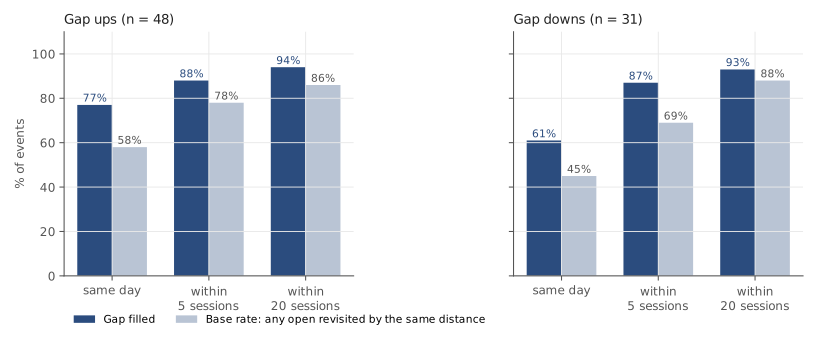
In 494 sessions there were 48 gap ups and 31 gap downs. They were mostly small: the median gap up was 0.53% and the median gap down 0.78%.
| Item | Gap ups filled | Base rate | Gap downs filled | Base rate |
|---|---|---|---|---|
| Same day | 77% | 58% | 61% | 45% |
| Within 5 sessions | 88% | 78% | 87% | 69% |
| Within 20 sessions | 94% | 86% | 93% | 88% |
| Events scored (5 / 20 sessions) | 48 / 48 | 30 / 27 |
Gap downs too close to the end of the data to have a full window are dropped: 1 from the 5-session test and 4 from the 20-session test. No gap ups needed dropping.
Britannia (NSE: BRITANNIA), daily bars, 1 April 2024 to 30 March 2026. Source: Yahoo Finance. Historical data, for illustration only.
What the numbers say
Two things are true at once.
Most of “gaps get filled” is just the base rate. Over 20 sessions an ordinary open got revisited by the same distance 86% of the time (matched to the gap ups) and 88% (matched to the gap downs). Gaps filled 94% and 93% of the time — 8 and 5 points more. When a tutorial says “over 90% of gaps fill”, most of that 90% would have happened to any price that close by.
On the gap day itself, there was something extra. Same-day fills beat the base rate by 19 points for gap ups and 16 for gap downs. You can see the same thing another way. From open to close, the stock fell an average of 0.75% on gap-up days (it closed above its open on only 23% of them) and rose 0.58% on gap-down days. Across all sessions, the average open-to-close move was −0.03%. In this sample, part of the overnight jump tended to come back during the day.
Before reading that as an edge, count what it rests on:
- 48 and 31 events, on one stock, over two years. A few unusual days can move an average like that a long way.
- The effect is small next to the costs. A round trip at this blog’s illustrative 0.1% per side costs 0.2%, before slippage at the open, which is exactly when prices move fastest.
- Opening prices are noisy. The open is one print at the start of the day. In our view, part of any “reversal from the open” is just that print being an outlier, which then looks like a move back.
- The unfilled ones are where the damage is. 11 gap ups and 12 gap downs didn’t fill the same day, and 3 gap ups were still unfilled 20 sessions later. Anyone betting on a fill has to survive those, and the tutorials never show them.
The biggest gap in the data
The largest gap was on 7 April 2025: a gap down of 8%, from a previous close of ₹5,023.4 to an open of ₹4,622. It filled the same day. That day is also a good warning. It doesn’t show that big gaps are safe to bet against. It shows that on a violent day the open can be far from where the stock settles, in either direction. One example proves nothing either way, which is why the table above counts all of them.
Doing it in Python
import pandas as pd

df = pd.read_csv("britannia-ohlcv-2024-04-to-2026-03.csv",
                 parse_dates=["date"]).set_index("date")

prev_close, prev_high = df.close.shift(), df.high.shift()
gap_up = df.open > prev_high                          # a visible hole in the chart

N = 5                                                  # fixed window, chosen first
low_ahead = df.low[::-1].rolling(N, min_periods=N).min()[::-1]  # min low, today..today+N-1
filled = (low_ahead <= prev_close)[gap_up & low_ahead.notna()]  # drop incomplete windows
print(f"gap ups: {gap_up.sum()}  filled within {N}: {filled.mean():.0%}")

# the base rate: for each gap's size, how often does ANY day's price come
# back that far below its own open within the same window?
ok = low_ahead.notna()
base = [(low_ahead <= df.open / (1 + d))[ok].mean()
        for d in (df.open / prev_close - 1)[gap_up]]
print(f"base rate, matched to each gap's size: {sum(base) / len(base):.0%}")
Change N to 1 or 20 for the other rows of the table.
Common mistakes
- Quoting the fill rate without the base rate. “90% of gaps fill” sounds like an edge. Here, an ordinary open got revisited by the same distance in well over three-quarters of the 20-session windows. The claim has to beat that, not zero.
- Leaving the window open-ended. “Gaps eventually fill” can’t lose, because a wandering price eventually revisits almost everything nearby. A claim with no time limit can’t be tested. Fix the window first.
- Confusing “filled” with “profitable”. A gap can fill after price has first run a long way against you. And every unfilled gap is a loss the fill statistic quietly leaves out.
- Changing the definition after looking. Open above yesterday’s close, open above yesterday’s high, gaps above 1% only, gaps on high volume only: each gives a different count. Try enough of them and one will look impressive by chance.
Takeaway: “Gaps get filled” is mostly true for a dull reason: most gaps are small, and prices revisit nearby levels all the time anyway. On two years of Britannia, gaps filled only somewhat more often than that base rate, mostly on the gap day itself. The effect was small next to costs and rested on a few dozen events, so treat it as a description, not an edge.
This post is for educational purposes only and is not investment advice. Wealth Primer explains concepts, not recommendations — nothing here is a suggestion to buy, sell, or hold any specific security or fund. The author is not a SEBI-registered Research Analyst or Investment Adviser. Any prices or figures used as worked examples are historical and shown only to illustrate a calculation. Past performance does not indicate future results. Please do your own research or consult a registered adviser before making investment decisions. See the privacy & disclaimer policy for more.