
Technical Analysis — Zero to Hero · Part 16 of 22
Fibonacci retracements: do 38.2, 50 and 61.8 really attract reversals?
The most decorative lines in charting
Open almost any chart shared online and you’ll find a ladder of horizontal lines labelled 23.6%, 38.2%, 50%, 61.8% and 78.6%. These are Fibonacci retracement levels. The claim behind them: after a big move, price tends to pull back by one of these fractions of the move before carrying on. The 61.8% line gets called the “golden” level.
In the spirit of the backtesting post, this post explains where the numbers come from, then checks them against 18 years of the Nifty 50.
Where the numbers come from
The Fibonacci sequence is 1, 1, 2, 3, 5, 8, 13, 21, 34, 55, 89… — each number is the sum of the two before it. Divide any number by the next one and, as the numbers grow, the answer settles at about 0.618. Divide by the number two places on and you get about 0.382. Those two ratios, and a few built from them (0.236, 0.786), are the “Fibonacci levels”.
The 50% level isn’t a Fibonacci ratio at all. It’s on every chart because “half the move came back” is a natural place to look. That tells you something already: the ladder is a mix of mathematics and habit.
The formula
For a move from a swing low to a swing high:
Range  = Swing high − Swing low

Level(r) = Swing high − r × Range        r = 0.236, 0.382, 0.5, 0.618, 0.786

Retracement depth of a pullback = (Swing high − Pullback low) / Range
For a fall, flip it: the levels sit above the swing low.
A worked example
Our zigzag (defined below) finds a Nifty swing from a close of 18,857 on 26 October 2023 to 23,264 on 3 June 2024. That’s a range of 4,407 points. The levels:
| Level | Nifty |
|---|---|
| 23.6% | 22,224 |
| 38.2% | 21,581 |
| 50% | 21,061 |
| 61.8% | 20,541 |
| 78.6% | 19,800 |
The pullback that followed bottomed at a close of 21,884 on 4 June 2024: a retracement of 31.3%, between the 23.6% and 38.2% lines and not especially close to either. Then the index went on to new highs.
Here’s the catch with any single example. Someone drawing these lines would point to the next bounce and call it “support near 38.2%”. With five lines on the chart, spaced roughly 12 to 17 points apart, any pullback ends reasonably near one of them. One example can’t tell you whether the lines mean anything. Only a count can.
Nifty 50 price index, 17 September 2007 to 30 March 2026, daily closes, from Yahoo Finance. Historical data, for illustration only.
The test
Finding the swings. We need a rule for “swing high” and “swing low” that doesn’t involve anyone’s judgement. A zigzag does this: a swing ends when price reverses by at least a set percentage from its extreme. With a 5% zigzag, a high counts as a swing high once the index has fallen 5% from it.
Measuring the pullbacks. For every three consecutive swing points A → B → C, the depth is how much of the A → B leg the B → C leg gave back. Only depths under 100% are pullbacks. Above 100%, the move fully reversed.
The comparison. We count how many pullbacks ended within ±2 points of 38.2%, 50% or 61.8%. Then we slide the same three-line ladder sideways — 4 to 10 points either way, fourteen ladders in all, like 34.2/46/57.8 or 46.2/58/69.8 — and count again. Nobody draws those shifted lines, so they’re a fair baseline. If the Fibonacci ladder is special, it should catch clearly more pullbacks than its shifted copies.
The 5% zigzag and ±2 points were fixed before counting. Other thresholds are just as defensible, so the table below reports four of them, not the best one.
What came out
With a 5% zigzag, the Nifty made 142 swings in 18.5 years, of which 70 were pullbacks.
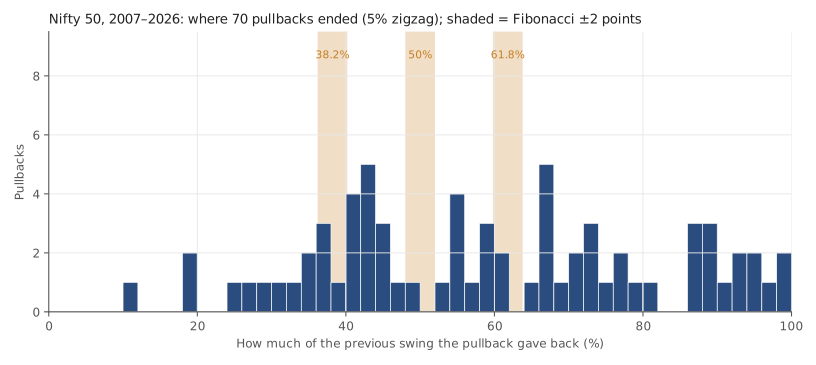
The pullbacks are spread across the whole range, mostly between about 30% and 100%. Look for spikes inside the shaded bands and you won’t find them.
| Zigzag | Pullbacks | Ended within ±2 of 38.2 / 50 / 61.8 | Shifted ladders, average | Shifted ladders doing at least as well |
|---|---|---|---|---|
| 3% | 147 | 16% | 16% | 10 of 14 |
| 5% | 70 | 9% | 20% | 14 of 14 |
| 8% | 37 | 11% | 16% | 14 of 14 |
| 10% | 30 | 13% | 15% | 11 of 14 |
At every threshold, the Fibonacci ladder caught no more pullbacks than the average shifted ladder. At the 5% and 8% thresholds, every one of the fourteen shifted ladders did at least as well. Across 18 years of the index, the famous ratios didn’t attract reversals any more than arbitrary lines did.
What this test can and can’t say
It’s a fair test of the strong claim: that pullbacks end at these ratios more often than elsewhere. It isn’t the last word:
- It’s one index, on closing prices. Intraday highs and lows would move some swing points, and individual stocks might behave differently. We don’t have their data here.
- The zigzag is one way of defining a swing. A trader’s eye picks swings differently — and that’s part of the problem. With hand-picked swings, there’s always a choice of anchor points that makes a level “work”.
- Self-fulfilling effects could exist on some charts. If enough people put orders at the 61.8% line on a particular stock, it might matter there. This test found no sign of it in the index overall.
Doing it in Python
import numpy as np, pandas as pd

s = pd.read_csv("nifty50-price-index.csv", parse_dates=["date"]
                ).set_index("date").nifty50_pri_close.to_numpy()

def zigzag(v, th=0.05):
    piv, trend, ext, lo, hi = [], 0, 0, 0, 0
    for i in range(1, len(v)):
        if trend == 0:                                  # wait for the first 5% move
            if v[i] >= v[lo] * (1 + th): piv, trend, ext = [lo], 1, i
            elif v[i] <= v[hi] * (1 - th): piv, trend, ext = [hi], -1, i
            else: lo, hi = (i if v[i] < v[lo] else lo), (i if v[i] > v[hi] else hi)
        elif (v[i] - v[ext]) * trend > 0: ext = i        # extend the current swing
        elif abs(v[i] / v[ext] - 1) >= th: piv.append(ext); trend, ext = -trend, i
    return v[piv]

P = zigzag(s)
depth = (P[1:-1] - P[2:]) / (P[1:-1] - P[:-2]) * 100
pull = depth[depth < 100]
hit = lambda levels: np.mean([min(abs(levels - d)) <= 2 for d in pull])
fib = np.array([38.2, 50, 61.8])
print(len(pull), f"fib {hit(fib):.0%}",
      [f"{hit(fib + k):.0%}" for k in (-8, -5, 5, 8)])
Common mistakes
- Drawing the levels after the bounce. Pick the swing low and high after you’ve seen where price turned, and one of five lines will always be “right”. Decide the anchors first.
- Counting near-misses as hits. “It bounced near 50%” at 46% is a 4-point miss on a 100-point scale. With five lines, every pullback is near something.
- No baseline. Without comparing to lines nobody watches, you can’t tell a special level from a merely nearby one. On this data, the shifted ladders did as well or better.
- Treating the golden ratio as a law of markets. 0.618 is real mathematics. Its appearance in sunflowers doesn’t make it a property of index pullbacks. That has to be tested, and here it didn’t show up.
Takeaway: Fibonacci ratios are real mathematics, but on 18 years of the Nifty, pullbacks ended near 38.2%, 50% and 61.8% no more often than near lines nobody draws. With five levels on a chart, a pullback always ends near one of them, so a “Fibonacci bounce” is easy to see and hard to prove.
This post is for educational purposes only and is not investment advice. Wealth Primer explains concepts, not recommendations — nothing here is a suggestion to buy, sell, or hold any specific security or fund. The author is not a SEBI-registered Research Analyst or Investment Adviser. Any prices or figures used as worked examples are historical and shown only to illustrate a calculation. Past performance does not indicate future results. Please do your own research or consult a registered adviser before making investment decisions. See the privacy & disclaimer policy for more.