
Technical Analysis — Zero to Hero · Part 22 of 22
Momentum vs mean reversion: does the trend continue, or snap back?
Two beliefs that can’t both be right
Listen to market commentary for a week and you’ll hear both of these, often from the same person:
- Momentum: “The trend is your friend.” What has been rising tends to keep rising.
- Mean reversion: “What goes up must come down.” A big move tends to be followed by a move back.
They predict opposite things from the same chart. On any horizon, at most one of them can describe the data, and quite possibly neither does. That makes them a good last test for this run of posts, which have all used the method from the backtesting post: fixed horizons, base rates, and every result reported.
The definitions
12-1 momentum. The return over the past twelve months, skipping the most recent month. The skip is standard in the research literature, because the latest month tends to behave differently (it’s where short-term reversal is usually found). A positive number means the market has been in an uptrend over the past year.
Short-term reversal. Just last month’s return. The mean-reversion idea is that a bad month tends to be followed by a better one, and a great month by a weaker one.
Autocorrelation. A single number for “does today’s return tell you anything about the next one?” It runs from −1 to +1. Positive means moves tend to continue, negative means they tend to reverse, and zero means no relationship at all.
The formula
At each month-end t:

12-1 momentum(t)    = Close(end of month t − 1) / Close(end of month t − 12) − 1
Last month(t)       = Close(end of month t)     / Close(end of month t − 1)  − 1
Next month(t)       = Close(end of month t + 1) / Close(end of month t)      − 1

Test: average Next month, split by the sign of 12-1 momentum
      (and by last month's return), against the average over all months.

Lag-1 autocorrelation = correlation(return(t), return(t − 1))
Rough noise band      = ± 2 / √(number of returns)
The data is the Nifty 50 price index, 17 September 2007 to 30 March 2026, from Yahoo Finance. The first month-end with a full twelve months behind it is September 2008, and the last with a month after it is February 2026: 210 month-ends. It’s a price index, so dividends are left out.
Momentum: the trend didn’t help
| At month-end, 12-1 momentum was… | Months | Next month, average | Median | Share positive |
|---|---|---|---|---|
| Positive (past year up) | 163 | 0.54% | 0.41% | 53% |
| Negative (past year down) | 47 | 2.55% | 2.84% | 66% |
| All months (base rate) | 210 | 0.99% | 0.79% | 56% |
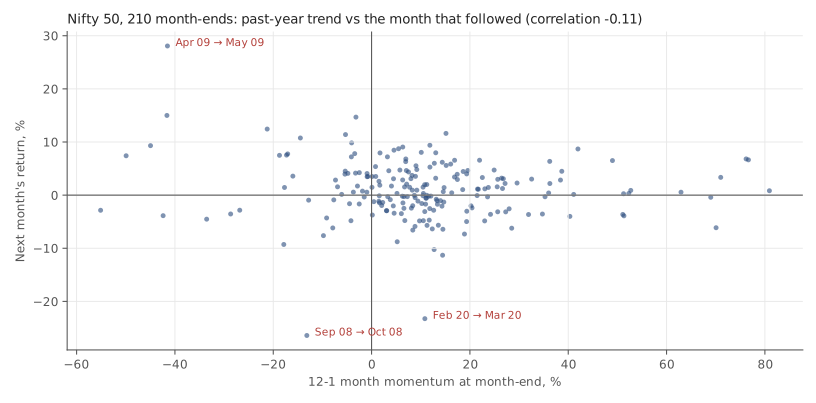
On this index, over this period, momentum pointed the wrong way. Months after a down year did better on average than months after an up year. The correlation between 12-1 momentum and the next month’s return was −0.11: slightly negative, and weak.
Is that just the 2009 rebound? We checked by dropping every signal from September 2008 to December 2009 (16 months). The pattern held: 2.73% after negative momentum (37 months) against 0.47% after positive (157).
Before turning that into “buy after bad years”, notice how thin it is. The past year was down at only 22% of month-ends, 47 months in all, and they cluster in a few episodes, mostly 2008–09, 2011–12, 2015–16 and 2020. That’s a handful of independent market episodes, not 47 independent observations. And the spread after negative momentum was much wider: a standard deviation of 8.1% a month, against 4.6% after positive momentum.
Nifty 50 price index. Source: Yahoo Finance. Historical data, for illustration only.
The chart makes the “weak” part visible: a cloud with no clear slope. And the labelled points are the months people remember:
| Month | 12-1 momentum at the previous month-end | Signal | What the month did |
|---|---|---|---|
| 2008-10 | −13.2% | negative | −26.4% |
| 2009-05 | −41.5% | negative | 28.1% |
| 2020-03 | 10.8% | positive | −23.2% |
| 2020-04 | −3.2% | negative | 14.7% |
The signal was on the right side of the October 2008 crash. It was on the wrong side of the May 2009 surge, the March 2020 crash and the April 2020 rebound. Trend rules usually get caught out when a trend turns sharply, and these are exactly those months.
Mean reversion: nothing to find
| Last month was… | Months | Next month, average | Median | Share positive |
|---|---|---|---|---|
| Up | 118 | 1% | 0.77% | 57% |
| Down | 92 | 0.97% | 0.79% | 55% |
| Worst fifth (≤ −2.9%) | 42 | 1.32% | 2.63% | 55% |
| Best fifth (≥ 4.7%) | 42 | 1.85% | 0.72% | 57% |
| All months (base rate) | 210 | 0.99% | 0.79% | 56% |
Up months and down months were followed by almost identical averages. The extreme fifths disagree with each other depending on whether you read the average or the median, which is what small groups with a few big months in them do. The correlation between one month and the next was 0.05: effectively zero.
The autocorrelations say the same thing more compactly:
| Returns | Pairs | Lag-1 autocorrelation | Rough noise band |
|---|---|---|---|
| Daily | 4,544 | 0.038 | ±0.03 |
| Weekly | 966 | 0.017 | ±0.064 |
| Monthly | 221 | −0.001 | ±0.135 |
Weekly and monthly are well inside the noise band. Daily sits just outside it, slightly positive (a very faint tendency for one day’s direction to carry into the next). Even so, a correlation of 0.038 means yesterday’s return explains well under 1% of the variation in today’s. That’s far too little to trade against a 0.1%-per-side cost.
What this does and doesn’t say about momentum
This test is narrow, and it’s worth being exact about how narrow.
- It’s time-series momentum on one index. The best-known momentum research is about something else: cross-sectional momentum, comparing stocks with each other and holding the recent winners against the recent losers (Jegadeesh and Titman, Journal of Finance, 1993). One index can’t test that at all.
- Time-series momentum has been studied across many markets at once. Moskowitz, Ooi and Pedersen (Journal of Financial Economics, 2012) looked at dozens of futures markets together. A single index over 18 years is one small slice of that kind of evidence. It doesn’t overturn it, and it doesn’t confirm it.
- So the honest conclusion is local. On the Nifty, from 2008 to 2026, a simple trend signal on the index itself didn’t point the right way, and last month’s move said nothing about next month’s.
Doing it in Python
import pandas as pd

s = pd.read_csv("nifty50-price-index.csv", parse_dates=["date"]
                ).set_index("date").nifty50_pri_close
me = s.resample("ME").last()

df = pd.DataFrame({
    "mom":  me.shift(1) / me.shift(12) - 1,        # 12-1: skip the latest month
    "last": me / me.shift(1) - 1,
    "next": me.shift(-1) / me - 1,                 # the outcome, one month ahead
}).dropna()                                        # drops incomplete windows

print(df.groupby(df.mom > 0).next.agg(["count", "mean", "median"]).round(4))
print(df.groupby(df["last"] > 0).next.agg(["count", "mean", "median"]).round(4))
for name, r in [("daily", s.pct_change()), ("monthly", me.pct_change())]:
    r = r.dropna()
    print(name, round(r.autocorr(), 3), "noise ±", round(2 / len(r) ** 0.5, 3))
Common mistakes
- Picking whichever belief fits the chart in front of you. “The trend is your friend” after a rise, “what goes up must come down” after a fall. Two opposite rules used after the fact will always explain everything.
- Reading an index result as a stock-picking result. Momentum across stocks and momentum in one index are different questions with different evidence.
- Counting months as if each were independent. Negative-momentum months come in clumps around a few crises. 47 months from a handful of episodes is much less evidence than it sounds.
- Mistaking a tiny correlation for a usable one. A daily autocorrelation of a few hundredths can be “statistically detectable” on 4,500 days and still be worth nothing after costs.
Where this leaves us
Put the tests from this run side by side and a consistent picture emerges. Gaps filled about as often as nearby prices get revisited anyway. Fibonacci levels caught no more pullbacks than lines nobody draws. The calendar looked like a pattern until the month labels were shuffled. Budget days were volatile but not directional. Oscillators and OBV divergences often came before the opposite of what their names say. Stops capped the worst loss but didn’t improve the average. And the trend on the index pointed the wrong way.
None of that proves these ideas never work anywhere. It does mean that, on the data in front of us, each one needed a base rate to be understood, and none of them survived one in the confident form it usually comes in. That’s exactly the argument of what technical analysis cannot do, now with the tests to back it: treat charts as a description of what happened, and be most sceptical of the idea that sounds most certain.
Takeaway: On 18 years of Nifty data, neither “the trend is your friend” nor “what goes up must come down” held up: months after a down year did better, and last month said nothing about next month. Momentum is a real research finding across many stocks and markets, but one index’s chart isn’t where you’ll see it.
This post is for educational purposes only and is not investment advice. Wealth Primer explains concepts, not recommendations — nothing here is a suggestion to buy, sell, or hold any specific security or fund. The author is not a SEBI-registered Research Analyst or Investment Adviser. Any prices or figures used as worked examples are historical and shown only to illustrate a calculation. Past performance does not indicate future results. Please do your own research or consult a registered adviser before making investment decisions. See the privacy & disclaimer policy for more.