
Technical Analysis — Zero to Hero · Part 21 of 22
Stop-loss placement: fixed %, ATR or swing low — how often each gets hit
A different kind of test
Every post in this run so far has tested a signal: something that claims to tell you what price will do next. A stop-loss doesn’t claim that. It’s a rule for getting out: if price falls to here, I sell. The position-sizing post showed why that matters. The stop distance, together with the rupees you’re willing to lose, sets how many shares you can hold.
So the useful questions about a stop aren’t “does it predict?” They are:
- How often does it get hit?
- When it’s hit, do you actually get out at the stop price?
- How often does it throw you out of a trade that would have recovered?
Those can all be measured.
Three ways to place a stop
| Rule | Stop price | The idea |
|---|---|---|
| Fixed 5% | Entry × (1 − 5%) | Simple, the same for every stock |
| 2 × ATR | Entry − 2 × ATR(14) | Wider when the stock is jumpy, tighter when it’s calm (Bollinger and ATR post) |
| Swing low | Just below the lowest low of the last 20 sessions | Below the level the market recently “defended” |
ATR (Average True Range) is the average daily range, including overnight gaps, smoothed over 14 sessions.
The formula for the test
Entry:     the close of EVERY session with 20 sessions of history
           and 20 sessions of future (no hand-picked entries)
Stop hit:  any later session's low ≤ stop price
Exit:      at the stop price — or at the open, if the stock opened below
           the stop (a gap straight through it)
Not hit:   exit at the close 20 sessions after entry
Costs:     0.1% per side, on every entry and exit

Whipsaw:   stopped out, but the close 20 sessions after entry was
           ABOVE the entry price
Entering on every day matters. Tutorials show a stop saving you from one crash they picked. Here there are 455 entries, from 2 May 2024 to 26 February 2026, good days and bad. The last 20 sessions of the data can’t be entries because they don’t have 20 sessions after them. Entries are a day apart, so neighbouring trades overlap heavily. Treat this as 455 related examples, not 455 independent experiments.
Britannia (NSE: BRITANNIA), daily bars, 1 April 2024 to 30 March 2026, from Yahoo Finance. Historical data, for illustration only.
How far away each stop sat
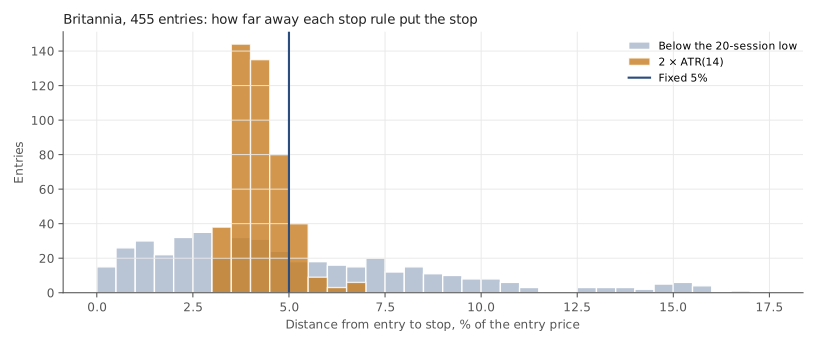
| Item | Fixed 5% | 2 × ATR | Swing low |
|---|---|---|---|
| Median distance from entry | 5% | 4.2% | 4.2% |
| Closest | 5% | 3.1% | 0.1% |
| Furthest | 5% | 6.8% | 16.9% |
The ATR stop moved within a fairly narrow band. The swing-low stop was all over the place: 0.1% away when the entry happened to be right at the recent low, and 16.9% away after a sharp rally. A stop placed by “where the chart says” can put very different amounts of money at risk from one day to the next, unless the position size adjusts to match.
What happened
| Item | No stop | Fixed 5% | 2 × ATR | Swing low |
|---|---|---|---|---|
| Stop hit within 20 sessions | — | 29% | 37% | 38% |
| Median sessions until hit | — | 10 | 8 | 4 |
| Stopped trades that would have been up at 20 sessions (whipsaw) | — | 13% | 19% | 30% |
| Gapped through the stop | — | 9 | 15 | 7 |
| Extra loss beyond the stop, when gapped | — | 1.53% | 1.34% | 0.27% |
| Average trade, after costs | 0.53% | 0.65% | 0.54% | 0.6% |
| Worst trade, after costs | −18.1% | −9.1% | −9.1% | −9.8% |
| Trades ending positive | 57% | 54% | 51% | 46% |
Four things stand out.
1. How often a stop is hit mostly depends on how far away it is. The ATR and swing-low stops had the same median distance and were hit about equally often. The fixed stop sat a little further away and was hit less. There’s no magic in the method. Closer stops get hit more.
2. The swing-low stop was hit fastest and whipsawed most. A median of 4 sessions to be stopped out, and 30% of those stops threw out a trade that was higher 20 sessions later. That’s what happens when many stops sit just under an obvious level. Ordinary day-to-day wobble reaches them.
3. A stop is not a guaranteed exit price. A 5% stop produced a worst loss of 9.1%, because the stock opened below the stop on a gap-down day. The largest gap in this data, covered in the gaps post, was 8%. Stops that were gapped through lost an average of an extra 1.53% (fixed) and 1.34% (ATR) beyond the stop price. Real fills can also be worse than a day’s low, which this test doesn’t model.
4. Stops changed the shape of outcomes, not the average. Without a stop the worst 20-session trade lost 18.1%. With any of the three, the worst was under 10%. But the average trade barely moved, and fewer trades ended positive. On overlapping entries from one stock, differences in the averages this small are noise. What a stop reliably did here was cap the damage from a single trade, and it paid for that in more small losses.
What this test can’t tell you
- Which rule is “best”. That depends on what you’re trying to limit, and how you size positions. A tighter stop with a bigger position can risk the same rupees as a wider stop with a smaller one.
- Anything beyond 20 sessions. A longer holding period gives every stop more time to be hit.
- Anything beyond this stock. A more volatile stock would hit the fixed 5% stop far more often, which is the whole argument for scaling stops to volatility in the first place.
Doing it in Python
import pandas as pd

df = pd.read_csv("britannia-ohlcv-2024-04-to-2026-03.csv",
                 parse_dates=["date"]).set_index("date")
o, lo, c = df.open.values, df.low.values, df.close.values
H, COST = 20, 0.001

def trade(i, stop):
    for j in range(i + 1, i + H + 1):
        if lo[j] <= stop:                           # stop touched
            return min(o[j], stop) / c[i] - 1 - 2 * COST, True   # gap → fill at open
    return c[i + H] / c[i] - 1 - 2 * COST, False

res = [trade(i, c[i] * 0.95) for i in range(20, len(df) - H)]   # every day, fixed 5%
r = pd.DataFrame(res, columns=["ret", "hit"])
print(f"hit {r.hit.mean():.0%}  avg {r.ret.mean():.2%}  worst {r.ret.min():.1%}")
Swap c[i] * 0.95 for c[i] - 2 * atr[i], or for the lowest low of the last
20 sessions, to test the other two rules.
Common mistakes
- Judging a stop by the one crash it avoided. Test it on every entry, including the ones where it threw you out just before a recovery.
- Assuming you’ll get the stop price. Overnight gaps go straight through stops. The worst loss on a 5% stop in this data was nearly double the stop distance.
- Putting the stop where everyone else does. Just under an obvious low is the most crowded place on the chart. Here it was hit fastest and whipsawed most.
- Choosing the distance without choosing the size. A stop’s distance only means something together with the number of shares. The position-sizing post covers that half.
Takeaway: How often a stop gets hit depends mostly on how far away it is, not on the method used to place it. On two years of Britannia, stops capped the worst trade but didn’t improve the average, and gaps pushed some losses well past the stop. A stop is a rule for limiting damage, not a guaranteed exit price.
This post is for educational purposes only and is not investment advice. Wealth Primer explains concepts, not recommendations — nothing here is a suggestion to buy, sell, or hold any specific security or fund. The author is not a SEBI-registered Research Analyst or Investment Adviser. Any prices or figures used as worked examples are historical and shown only to illustrate a calculation. Past performance does not indicate future results. Please do your own research or consult a registered adviser before making investment decisions. See the privacy & disclaimer policy for more.