
Risk, Leverage and Your Own Brain · Part 3 of 16
Position sizing: the 1% rule, and letting volatility pick the number
The question almost nobody asks first
Most conversations about a trade or an investment are about what and when. Which stock, which fund, which level, which day. The question that decides whether a bad call is survivable — how much — usually gets answered by feel: a round number, whatever’s in the account, “about the same as last time.”
Position sizing is the discipline of answering that question first, and answering it from the amount you’re prepared to lose rather than the amount you hope to make. This post shows the standard method, with one twist that matters more than the rule itself: letting the market’s own volatility set the number.
Everything here is method, worked on historical prices. It isn’t a suggestion to buy anything. The specific numbers — 1% risk, a stop at 2× ATR — are conventions from the trading literature, not a recommended setting. And stop-based sizing is a trading tool: it doesn’t map neatly onto long-term investing in funds, where there’s no stop price and the plan is to sit through drawdowns rather than exit on them.
The formula
Risk per position (₹)  =  Capital × risk %             (the 1–2% rule)

Shares  =  Risk per position  /  Stop distance per share

Stop distance  =  k × ATR                              (k is usually 1.5–3)
Three ideas stacked up:
- Decide the rupees you’ll lose if you’re wrong before you decide anything else. The convention is 1% of capital per position, 2% at the aggressive end. On ₹10,00,000 that’s ₹10,000.
- Decide where “wrong” is — the exit price that proves the idea didn’t work. The distance from entry to that exit is your risk per share.
- Divide. Rupees you’ll risk ÷ rupees at risk per share = shares.
Step 2 is where volatility comes in.
ATR: how much does this thing normally move?
ATR — Average True Range — is the average of each day’s true range over the last 14 days, where true range is the largest of: today’s high minus low, the gap from yesterday’s close up to today’s high, and the gap from yesterday’s close down to today’s low. Wilder’s smoothing, same as the RSI.
TR  =  max( High − Low,  |High − Prev Close|,  |Low − Prev Close| )
ATR =  Wilder-smoothed 14-day average of TR   (α = 1/14)
It answers one question: on a normal day, how far does this stock travel? A stop placed inside that distance will be hit by ordinary noise, not by the idea being wrong. So the stop goes a multiple of ATR away — 2× is a common default — and the position is sized so that being stopped out costs exactly the rupees decided in step 1.
🧒 Explain it like I'm 10 (optional — skip if this is already clear)
Imagine you’re allowed to lose at most ₹100 playing carnival games. One game costs ₹5 a go, another costs ₹20 a go. You can afford 20 tries at the first and only 5 at the second — same ₹100 either way.
ATR tells you how much a stock “costs a go” — how far it normally wobbles. A wobbly stock costs more per share to hold safely, so you hold fewer shares. The ₹100 you’re willing to lose stays the same. The number of tries changes.
Worked example: Britannia, three days, three sizes
Britannia (NSE: BRITANNIA), daily data 1 April 2024 to 30 March 2026. Source: Yahoo Finance. Historical data, for illustration only — these dates were chosen after the fact to show the range, which is exactly what you can’t do in real time.
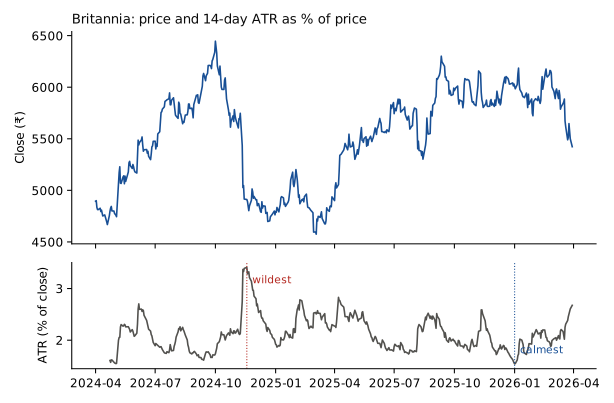
Over these two years the 14-day ATR ranged from ₹73.6 to ₹169.4 a share — 1.54% to 3.41% of the price. Fix the rules (₹10,00,000 capital, 1% risk, stop at 2× ATR) and see what they produce on the calmest day, a middling one, and the wildest (days picked by ATR as a % of price):
| Item | Calmest day | Middling day | Wildest day |
|---|---|---|---|
| Date | 2026-01-01 | 2025-06-30 | 2024-11-18 |
| Close | ₹6,009.5 | ₹5,851 | ₹4,911.4 |
| 14-day ATR | ₹92.7 (1.54%) | ₹104.7 (1.79%) | ₹167.5 (3.41%) |
| Stop distance (2 × ATR) | ₹185.4 | ₹209.5 | ₹334.9 |
| Stop price | ₹5,824.1 | ₹5,641.5 | ₹4,576.4 |
| Risk budget (1%) | ₹10,000 | ₹10,000 | ₹10,000 |
| Shares | 53 | 47 | 29 |
| Position value | ₹3,18,504 | ₹2,74,997 | ₹1,42,429 |
| As % of capital | 31.9% | 27.5% | 14.2% |
Rows are computed from unrounded prices and ATRs, so the rounded figures shown can be a rupee off when you redo the sums by hand.
Same stock, same rules, and the position is 2.2 times as large by value on the calm day as on the wild one. That is the method working as designed. On 18 November 2024 — inside the 24.3% fall over the three months after 20 September 2024 that the RSI post documented — the stock was moving 3.41% a day. A stop had to sit further away to survive the noise, so fewer shares could be held for the same ₹10,000 of risk.
Now compare the habit most people actually have — buying a fixed number of shares, say 50, regardless:
| 50 shares, 2× ATR stop | Calmest day | Middling day | Wildest day |
|---|---|---|---|
| Rupees at risk | ₹9,270 | ₹10,475 | ₹16,745 |
| As % of capital | 0.93% | 1.05% | 1.67% |
The fixed-share buyer thinks they’re taking the same risk every time. They aren’t. On the wildest day they’re risking 1.67% of capital without having decided to — nearly double the calm-day figure, and right when the market is at its least forgiving.
Why 1–2%
The number isn’t sacred; the logic behind it is. Recall the recovery table: a 20% drawdown needs a 25% gain to repair, a 50% drawdown needs 100%. Risking 1% per position means a run of ten consecutive losers — which will happen to anyone who trades long enough — costs about 10%. At 5% per position, the same run costs about 40%, and the account needs a 67% gain just to get back to where it started. Position sizing is how you make sure your worst realistic streak is a setback and not an ending. The risk of ruin and Kelly criterion post works through the maths of how much to stake on an edge.
It also does something quieter: it separates how sure you are from how much you hold. Conviction is the least reliable input in investing. Sizing by volatility takes it out of the calculation.
Doing it in Python
import pandas as pd

df = pd.read_csv("britannia-ohlcv-2024-04-to-2026-03.csv",
                 parse_dates=["date"]).set_index("date")

prev = df.close.shift(1)
tr = pd.concat([df.high - df.low,
                (df.high - prev).abs(),
                (df.low - prev).abs()], axis=1).max(axis=1)
df["atr"] = tr.ewm(alpha=1/14, adjust=False).mean()   # Wilder

capital, risk_pct, k = 10_00_000, 0.01, 2
df["stop_dist"] = k * df.atr
df["shares"] = (capital * risk_pct // df.stop_dist).astype(int)

print(df[["close", "atr", "stop_dist", "shares"]].iloc[14:].describe().round(1))
Skip the first 14 rows — like every smoothed indicator, ATR has a warmup during which its values mean nothing.
Common mistakes
- Sizing by conviction. “I’m really sure about this one” is exactly when a fixed risk budget earns its keep.
- Buying the same number of shares every time. As the second table shows, that’s a random risk budget wearing a consistent-looking costume.
- Placing the stop inside the ATR. A stop closer than one day’s normal range is a coin-flip on noise, not a test of the idea.
- Reading 1% risk as 1% exposure. They’re different numbers. On Britannia’s calmest day the 1% rule put 31.9% of capital into one stock. If that stock gaps down 20% overnight, straight through the stop, the loss is about 6.4% of capital, not 1%. That’s why many practitioners also cap any single position as a percentage of capital, whatever the formula says.
- Treating the stop as a guarantee. Stops are orders, not promises. Gaps at the open and illiquid stocks can take you out well past the stop price — which is a reason to size smaller than the formula, not larger.
- Applying the rule per position but not per portfolio. Ten positions at 1% each in ten highly correlated stocks is closer to one position at 10%. The diversification post covers why.
- Forgetting the rule exists once a position is winning. Position sizing governs entries. It says nothing about when to take profits, and it isn’t a trading system. It just keeps you in the game long enough for one to matter.
Takeaway: Decide the rupees you’ll lose before you decide what to buy, then let the stock’s own volatility set how many shares that buys. On Britannia, the same 1% rule produced 53 shares on its calmest day and 29 on its wildest — the method is supposed to hold less of what’s moving more. Most people do the opposite without noticing.
This post is for educational purposes only and is not investment advice. Wealth Primer explains concepts, not recommendations — nothing here is a suggestion to buy, sell, or hold any specific security or fund. The author is not a SEBI-registered Research Analyst or Investment Adviser. Any prices or figures used as worked examples are historical and shown only to illustrate a calculation. Past performance does not indicate future results. Please do your own research or consult a registered adviser before making investment decisions. See the privacy & disclaimer policy for more.