
Risk, Leverage and Your Own Brain · Part 5 of 16
Diversification is a correlation problem, not a counting problem
“I’m diversified — I hold eight funds”
Ask an Indian retail investor how they manage risk and the most common answer is a count: eight funds, twenty stocks, three AMCs (asset management companies, the firms that run mutual funds). The count feels like safety. Often it isn’t, because diversification was never about how many things you own. It’s about whether they fall at the same time.
The number that measures “at the same time” is correlation, and this post is about what it does to a portfolio — with the arithmetic, and with two years of real daily returns.
The formula
Correlation (ρ) between two return series:  from −1 to +1
    +1  →  always move together, in proportion
     0  →  no linear relationship
    −1  →  always move opposite

Volatility of a two-asset portfolio (weights w₁, w₂; volatilities σ₁, σ₂):

    σ²(portfolio)  =  w₁²σ₁²  +  w₂²σ₂²  +  2·w₁·w₂·ρ·σ₁·σ₂

Many equally weighted assets, each with volatility σ, all pairwise ρ:

    σ²(portfolio)  =  σ² × [ 1/n  +  (1 − 1/n)·ρ ]
The middle line is the one that does the work. If ρ is 1, the portfolio volatility is just the weighted average of the two — you’ve gained nothing. Anything below 1 makes the last term smaller, and the portfolio is less volatile than the average of its parts. That reduction is the only thing diversification gives you, and ρ controls how much of it you get.
🧒 Explain it like I'm 10 (optional — skip if this is already clear)
You sell ice cream. To be safe you open a second stall — also selling ice cream, on the same beach. On a rainy day both stalls are empty. You have two stalls and one problem.
Now suppose the second stall sells umbrellas instead. Rainy day: ice cream is dead, umbrellas fly. Sunny day: the reverse. Some money comes in every day.
Two ice-cream stalls are “correlated” — they have good and bad days together. Ice cream and umbrellas aren’t. Owning two things only helps when they don’t have their bad days at the same time.
Table one: what correlation does to two assets
Two assets, each with 20% annual volatility, held 50/50:
| Correlation ρ | Portfolio volatility |
|---|---|
| 1.0 | 20.0% |
| 0.9 | 19.5% |
| 0.7 | 18.4% |
| 0.5 | 17.3% |
| 0.2 | 15.5% |
| 0.0 | 14.1% |
| −0.5 | 10.0% |
At ρ = 1 you own two things and get one thing’s risk. How correlated are real Indian equity funds? Two funds from this blog’s data — the UTI Nifty 50 Index Fund and Parag Parikh Flexi Cap, a flexi-cap fund that also holds foreign stocks — correlated at 0.77 on daily returns and 0.84 on monthly returns, 2013–2026. Two large-cap funds holding the same companies will usually sit higher still. At ρ = 0.9 you’ve shaved half a percentage point. You have to get down to a correlation near zero before the portfolio is meaningfully calmer than either piece, and negative correlations, which are rare and unstable, are where the dramatic reductions live.
Table two: what adding more of the same does
Now hold n assets, equally weighted, each 20% volatile, every pair correlated at 0.7 — a generous stand-in for “a lot of Indian equity funds”, since the two real funds above were more correlated than that:
| Holdings (n) | Portfolio volatility |
|---|---|
| 1 | 20.0% |
| 2 | 18.4% |
| 5 | 17.4% |
| 10 | 17.1% |
| 20 | 16.9% |
| 50 | 16.8% |
| 1,000 | 16.7% |
Going from one holding to two removes 1.6 percentage points of volatility. Going from ten to a thousand removes 0.4. The formula’s floor is σ × √ρ = 16.7%, and no amount of counting gets below it. That floor is the risk the holdings share — the market itself — and the only way under it is to add things that aren’t correlated, not more things that are.
This is what “eight funds” usually buys: a portfolio close to the floor (17.2% against 16.7%), with eight expense ratios.
Worked example: Britannia and the Nifty 50
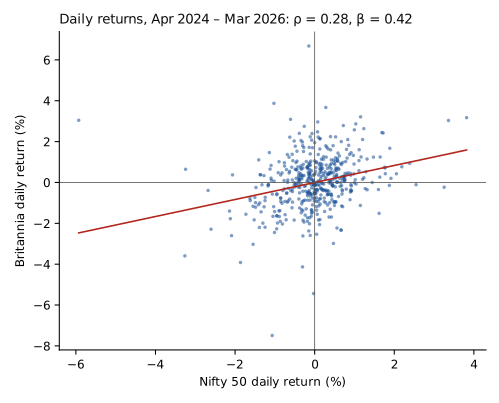
Daily returns of Britannia (NSE: BRITANNIA) against the Nifty 50 price index, 2 April 2024 to 30 March 2026, 493 trading days. Sources: Yahoo Finance, BRITANNIA.NS and Yahoo Finance, ^NSEI. Historical data, for illustration only.
| Item | |
|---|---|
| Correlation, Britannia vs Nifty 50 | 0.28 |
| Beta of Britannia to the Nifty 50 (see below) | 0.42 |
| 60-day rolling correlation, lowest | −0.11 (20 November 2025) |
| 60-day rolling correlation, highest | 0.56 (30 March 2026) |
| Britannia annualised volatility | 20.6% |
| Nifty 50 annualised volatility | 13.8% |
| Naive average of the two | 17.2% |
| Volatility of a 50/50 portfolio | 13.9% |
Beta measures how much a stock tends to move for each 1% move in the index: a beta of 0.42 means Britannia moved, on average, about 0.42% for every 1% the Nifty 50 moved. It combines correlation with relative volatility.
Two things here.
First, a single FMCG (fast-moving consumer goods) stock and the broad index had a correlation of only 0.28 over these two years — lower than most people would guess for a Nifty 50 constituent. It moved on its own news (the FY25 margin compression the gross margin post discussed, for one) as much as on the market’s. And the relationship wasn’t stable: over 60-day windows it ranged from −0.11 to 0.56. Correlation is a description of a period, not a property of a stock.
Second, look at what that did to a 50/50 mix. Averaging the two volatilities gives 17.2%. The actual portfolio volatility was 13.9% — barely above the index alone (13.8%), despite half the money sitting in a stock that was 20.6% volatile. The low correlation ate most of Britannia’s extra bounce. That is diversification doing something.
For contrast, the UTI Nifty 50 Index Fund — a fund built to track that same index — had a correlation of 0.9998 with it over 2007–2026. Holding it alongside another Nifty 50 fund, or alongside a large-cap fund whose top holdings are the same fifty companies, is table one’s first row. Two names, one bet.
What this means in practice
Diversification is a question about what moves together, so the useful audit isn’t “how many do I hold?” but:
- Do my equity funds hold the same companies? (Overlap between large-cap funds can exceed half the portfolio.)
- Is everything I own priced off the same thing — Indian equity, Indian rates, the rupee?
- What did all of it do in March 2020, together?
The drawdown post showed a fifty-stock index falling 60%. Fifty holdings didn’t prevent that, because fifty Indian large-caps in a crash have a correlation much closer to one. The things that would have helped weren’t more stocks. They were things that weren’t stocks.
Doing it in Python
import pandas as pd, numpy as np

brit = pd.read_csv("britannia-ohlcv-2024-04-to-2026-03.csv",
                   parse_dates=["date"]).set_index("date").close
nifty = pd.read_csv("nifty50-price-index.csv",
                    parse_dates=["date"]).set_index("date").nifty50_pri_close

rets = pd.concat([brit, nifty], axis=1, keys=["brit", "nifty"]).dropna().pct_change().dropna()
rho = rets.brit.corr(rets.nifty)
beta = rets.brit.cov(rets.nifty) / rets.nifty.var()
vol = rets.std() * np.sqrt(252) * 100

w = np.array([0.5, 0.5])
port_vol = np.sqrt(w @ rets.cov().values @ w) * np.sqrt(252) * 100
print(f"rho {rho:.2f}  beta {beta:.2f}  vols {vol.round(1).to_dict()}  "
      f"50/50 portfolio {port_vol:.1f}%")
print(rets.brit.rolling(60).corr(rets.nifty).describe().round(2))
w @ cov @ w is the two-asset formula from above, generalised to any number
of holdings — feed it a whole portfolio’s return matrix and it tells you what
your diversification is actually worth.
Common mistakes
- Counting holdings instead of measuring correlation. Table two: past ten, the count stops mattering. What you add matters.
- Assuming two funds with different names are different bets. Check the holdings. Two large-cap funds are usually one position.
- Treating correlation as fixed. Britannia’s ran from −0.11 to 0.56 within two years. And in a crash, correlations between risky assets rise toward one — precisely when you need them not to.
- Diversifying within one asset class and calling it done. Fifty Indian stocks are still one exposure to Indian equity.
- Confusing low correlation with low risk. Britannia was more volatile than the index. It kept the 50/50 mix almost as calm as the index alone only because it was volatile at different times. Both facts matter.
- Paying eight expense ratios for one portfolio. If the funds are at the correlation floor, the fees are the only thing you’ve multiplied.
Takeaway: Diversification reduces risk only to the extent the things you own fall at different times, and correlation is the number that measures that. Ten equity funds correlated at 0.7 get you a portfolio only about 14.5% less volatile than one (17.1% vs 20%), and no number of them gets below 16.7% — while a single stock correlated at 0.28 with the index cut a 50/50 portfolio’s bounce almost to the index’s own. Count less; check what moves together.
This post is for educational purposes only and is not investment advice. Wealth Primer explains concepts, not recommendations — nothing here is a suggestion to buy, sell, or hold any specific security or fund. The author is not a SEBI-registered Research Analyst or Investment Adviser. Any prices or figures used as worked examples are historical and shown only to illustrate a calculation. Past performance does not indicate future results. Please do your own research or consult a registered adviser before making investment decisions. See the privacy & disclaimer policy for more.