
Risk, Leverage and Your Own Brain · Part 11 of 16
Concentration risk: when one stock is most of what you own
The portfolio nobody chose
Plenty of Indian investors hold one stock as most of their wealth without ever deciding to. An engineer whose ESOPs (employee stock options) and RSUs (restricted stock units) have vested for eight years. A family whose savings sit in the listed company a grandparent founded. Someone who bought one share early, watched it multiply, and never trimmed.
Concentration risk is the risk that comes from a large share of your money depending on a single company, sector or source. It isn’t that the one stock is bad. It’s that you’re exposed to everything that can happen to one business — a lost contract, a fraud, a regulatory change, a management mistake — with nothing else in the portfolio to absorb it.
This post measures that on real prices. Britannia is used only because this blog already has its price history; nothing here is a view on the company.
The formula
A stock's variance splits into two parts:

    σ²(stock)  =  β² × σ²(market)   +   σ²(specific)
                  └ moves with the market ┘   └ the company's own news ┘

Share of the stock's variance the market explains  =  ρ²
Share that is company-specific                     =  1 − ρ²

A portfolio with weight w in the stock and (1 − w) in the index:

    σ²(portfolio)  =  w²σ²(stock) + (1 − w)²σ²(index) + 2·w·(1 − w)·ρ·σ(stock)·σ(index)
The first line is the key. Market risk is shared by everything you could own; diversification can’t remove it. The company-specific part is the risk that diversification does remove — which is the only reason to hold more than one thing. A concentrated portfolio keeps it, all of it. Beta (β) and correlation (ρ) are explained in the beta post and the diversification post.
Worked example: ₹10 lakh, four ways, April 2024 to March 2026
Britannia (NSE: BRITANNIA) daily closing prices and the Nifty 50 price index, 1 April 2024 to 30 March 2026 (494 common trading days; sources: Yahoo Finance, BRITANNIA.NS and Yahoo Finance, ^NSEI). Both are price series — dividends excluded on both sides, so the comparison is like for like. Historical data, for illustration only.
Over this window Britannia’s correlation with the index was 0.28, so the market explained about 8% of its daily variance. The other 92% was Britannia’s own.
Four ₹10,00,000 portfolios, bought on day one and left alone:
| Item | 100% Britannia | 70% Britannia / 30% index | 50 / 50 | 100% Nifty 50 |
|---|---|---|---|---|
| Value at the end (₹) | 11,07,820 | 10,73,730 | 10,51,003 | 9,94,186 |
| Return over the period | 10.8% | 7.4% | 5.1% | −0.6% |
| Annualised volatility | 20.6% | 16.2% | 14% | 13.8% |
| Maximum drawdown | −29% | −25% | −22.2% | −15.8% |
| Maximum drawdown (₹) | 3,82,181 | 3,17,133 | 2,73,769 | 1,84,017 |
| Worst 21-trading-day return | −19.3% | −15.5% | −12.9% | −12.4% |
| Lowest value reached (₹) | 9,34,630 | 9,49,174 | 9,58,871 | 9,74,290 |
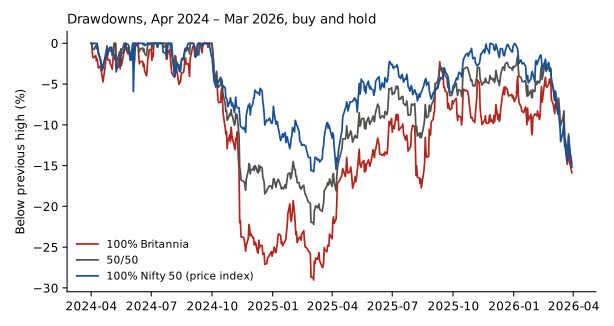
Read it honestly, because it cuts both ways.
The single stock ended ahead. Over these particular two years, 100% Britannia returned 10.8% while the index returned −0.6%, a gap of 11.4 percentage points. Concentration can do that — it’s the reason people stay concentrated.
The ride was much rougher. The one-stock portfolio fell 29% from its peak (1 October 2024) to its trough (4 March 2025) — ₹3,82,181 on paper — against 15.8% for the index. Its volatility was 20.6% against 13.8%. Every step of diversification in the table narrows the swings. The 50/50 mix’s volatility was close to the index’s (14% against 13.8%), though its drawdown was still deeper.
One path isn’t the distribution. This is the part a two-year chart can’t show. The index’s result is roughly what an index holder gets, give or take. A single stock’s result is one draw from a very wide range. The company-specific part — 92% of the variance here — happened to help this time; it could as easily have hurt, and for some companies it ends at zero. Looking at the one stock you happened to hold, after it did well, is survivorship bias in miniature.
🧒 Explain it like I'm 10 (optional — skip if this is already clear)
Your whole class bets on the cricket score. Some kids bet on the total runs of the whole team. One kid bets everything on one batter.
When the team has a normal day, the team-bettors get a normal result. The one-batter kid gets either a big win (century!) or nothing (duck!). Over a season, the team-bettors’ results cluster together. The one-batter kids’ results are all over the place — a few very happy, some very sad.
Holding one stock is being the one-batter kid. It isn’t wrong to be lucky. It’s just that you can’t tell, in advance, whether you’re the century or the duck.
The ESOP problem: two bets on one company
For an employee, concentration is worse than the table suggests, because the paycheck is a second position in the same company. If the business hits trouble, the share price, the bonus and possibly the job can all go at once — exactly when you’d want your savings to be doing something different from your income. That’s correlation again, just between your portfolio and your career.
There are practical frictions too. Vesting schedules and lock-ins decide when shares can be sold. Employees classed as “designated persons” under their company’s insider-trading code can only trade in open trading windows. And selling has tax consequences at vesting and at sale — the tax series covers how ESOPs and RSUs are taxed. None of these makes concentration less risky; they make it slower to reduce.
Doing it in Python
import pandas as pd, numpy as np

brit = pd.read_csv("britannia-ohlcv-2024-04-to-2026-03.csv",
                   parse_dates=["date"]).set_index("date").close
nifty = pd.read_csv("nifty50-price-index.csv",
                    parse_dates=["date"]).set_index("date").nifty50_pri_close
px = pd.concat([brit, nifty], axis=1, keys=["stock", "index"], sort=True).dropna()
rel = px / px.iloc[0]

for w in (1.0, 0.7, 0.5, 0.0):
    v = 10_00_000 * (w * rel.stock + (1 - w) * rel["index"])   # buy and hold
    dd = (v / v.cummax() - 1).min()
    vol = v.pct_change().std() * np.sqrt(252)
    print(f"{w:.0%} stock: end {v.iloc[-1]:,.0f}  vol {vol:.1%}  max drawdown {dd:.1%}")

print("market's share of the stock's variance:",
      round(px.pct_change().corr().iloc[0, 1] ** 2, 3))
Common mistakes
- Judging concentration by how it turned out. A concentrated position that did well looks like conviction; one that did badly looks like a mistake. Both were the same risk. Judge the size of the bet, not the outcome.
- Counting the stock at its peak value. A holding that has multiplied feels like “house money”. A drawdown of 29% on a position that’s half your net worth is a real loss, whatever you originally paid.
- Forgetting your job is a position. Salary, bonus and ESOPs from one employer are one exposure, not three.
- Thinking a sector fund or a handful of related stocks fixes it. Five private banks or three group companies share most of their risk. Check how they move together, not how many there are.
- Assuming the market will warn you. Company-specific shocks — accounting problems, a lost licence — often arrive as a gap, not a trend. The arithmetic of losses applies to them with no time to react.
Takeaway: Concentration widens the range of outcomes, because it keeps the company-specific risk that diversification would have removed. Over these two years a single stock beat the index and fell nearly twice as far on the way. You can’t know in advance which side of the range your one stock will land on.
This post is for educational purposes only and is not investment advice. Wealth Primer explains concepts, not recommendations — nothing here is a suggestion to buy, sell, or hold any specific security or fund. The author is not a SEBI-registered Research Analyst or Investment Adviser. Any prices or figures used as worked examples are historical and shown only to illustrate a calculation. Past performance does not indicate future results. Please do your own research or consult a registered adviser before making investment decisions. See the privacy & disclaimer policy for more.