
Risk, Leverage and Your Own Brain · Part 12 of 16
Currency risk: what the rupee does to your foreign investments
Two returns, not one
Buy a US index fund, a Nasdaq ETF (exchange-traded fund) or a few US shares from India, and the number that lands in your rupee account is the product of two separate returns: what the asset did in dollars, and what the dollar did against the rupee. You chose the first. The second came free with it.
Currency risk is the uncertainty in your return that comes from exchange rates moving. For an Indian investor it shows up whenever an asset or a liability is priced in another currency: international mutual funds, US stocks bought directly, but also a child’s future fees at a foreign university or an EMI (equated monthly instalment) on a loan in dollars.
The formula
Rupee return  =  (1 + return in dollars) × (1 + change in rupees per dollar)  −  1

    ≈  return in dollars  +  change in USD/INR          (for small numbers)

Change in USD/INR  =  (rupees per dollar at the end / at the start)  −  1
    positive  →  the rupee weakened  →  good for a rupee holder of dollar assets
    negative  →  the rupee strengthened  →  bad for a rupee holder of dollar assets
A weaker rupee helps you if you own dollar assets and hurts you if you owe dollars. Same rate, opposite sign, depending on which side you’re on.
🧒 Explain it like I'm 10 (optional — skip if this is already clear)
Your cousin in America keeps your $10 in her piggy bank. When you visit, you swap it back into rupees.
If one dollar buys ₹80 when you visit, your $10 is ₹800. If it buys ₹90, the same $10 is ₹900 — you’re richer without the piggy bank doing anything. If it buys ₹70, you’re poorer.
So money kept in another country’s currency goes up and down for two reasons: what happens inside the piggy bank, and how many rupees one dollar is worth on the day you swap.
Worked example: twenty financial years of USD/INR
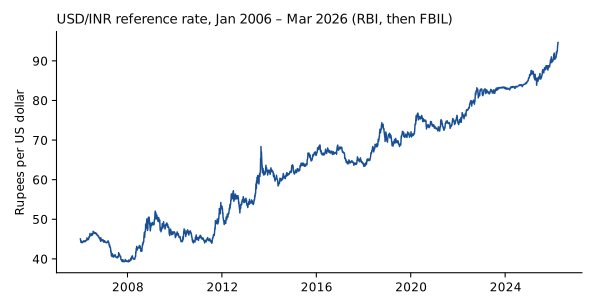
Rupees per US dollar at each financial-year end, from the RBI (Reserve Bank of India) reference rate (archive) up to 9 July 2018 and the FBIL (Financial Benchmarks India Ltd) reference rate from 10 July 2018, when FBIL took over the benchmark (fbil.org.in; our CSV). The last column is the UTI Nifty 50 Index Fund’s return in the same year (regular plan, AMFI, the Association of Mutual Funds in India, via mfapi.in). Data to 30 March 2026; historical, for illustration only.
| Year | Date | ₹ per $ | Change in ₹ per $ | Index fund return |
|---|---|---|---|---|
| FY07 | 2007-03-30 | 43.59 | −2.3% | 11% |
| FY08 | 2008-03-31 | 39.97 | −8.3% | 22% |
| FY09 | 2009-03-31 | 50.95 | 27.5% | −36.3% |
| FY10 | 2010-03-31 | 45.14 | −11.4% | 71.8% |
| FY11 | 2011-03-31 | 44.65 | −1.1% | 10.7% |
| FY12 | 2012-03-30 | 51.16 | 14.6% | −9.4% |
| FY13 | 2013-03-28 | 54.39 | 6.3% | 7.8% |
| FY14 | 2014-03-28 | 60.1 | 10.5% | 18.1% |
| FY15 | 2015-03-31 | 62.59 | 4.1% | 27.5% |
| FY16 | 2016-03-31 | 66.33 | 6% | −8.1% |
| FY17 | 2017-03-31 | 64.84 | −2.3% | 19.5% |
| FY18 | 2018-03-28 | 65.04 | 0.3% | 11.5% |
| FY19 | 2019-03-29 | 69.17 | 6.3% | 16% |
| FY20 | 2020-03-31 | 75.39 | 9% | −25.4% |
| FY21 | 2021-03-31 | 73.5 | −2.5% | 72.1% |
| FY22 | 2022-03-31 | 75.81 | 3.1% | 19.8% |
| FY23 | 2023-03-31 | 82.22 | 8.5% | 0.3% |
| FY24 | 2024-03-28 | 83.37 | 1.4% | 29.6% |
| FY25 | 2025-03-28 | 85.58 | 2.6% | 6.3% |
| FY26 | 2026-03-30 | 94.65 | 10.6% | −4.3% |
From ₹44.61 on 31 March 2006 to ₹94.65 on 30 March 2026, the dollar rose 112% against the rupee — 3.8% a year compounded over 20 years. But not smoothly, and not every year:
- The rupee weakened in 14 of the 20 years and strengthened in 6.
- Its worst year was FY09, when the dollar rose 27.5%. Its best was FY10, when the dollar fell 11.4%.
- In FY26 alone the dollar rose 10.6%.
- Day to day, USD/INR was far calmer than equities: annualised volatility of 6.9% against 21.1% for the Nifty 50 price index, over the dates both are available since September 2007.
Putting the two returns together
Take a hypothetical US asset that returned +10%, 0% or −10% in dollars, and apply two real years — FY08, when the rupee strengthened, and FY26, when it weakened:
| Year | Return in dollars (hypothetical) | Change in ₹ per $ (actual) | Return in rupees |
|---|---|---|---|
| FY08 | 10% | −8.3% | 0.9% |
| FY08 | 0% | −8.3% | −8.3% |
| FY08 | −10% | −8.3% | −17.5% |
| FY26 | 10% | 10.6% | 21.7% |
| FY26 | 0% | 10.6% | 10.6% |
| FY26 | −10% | 10.6% | −0.5% |
The same +10% dollar return became 0.9% in one year and 21.7% in another. A flat asset returned −8.3% and 10.6% purely from the exchange rate. For a single year, the currency can matter as much as the investment.
Does the rupee fall when Indian stocks fall?
The index fund fell in 5 of the 20 years (FY09, FY12, FY16, FY20, FY26). The rupee weakened in 5 of those 5 — including FY09 (−36.3% for the fund, dollar up 27.5%) and FY20 (−25.4%, dollar up 9%). In those years a dollar asset held by a rupee investor got a cushion exactly when the Indian one hurt.
Check the base rate before making much of it. The rupee weakened in 70% of all years, including 9 of the 15 years the fund rose. If each year were a coin weighted to that rate, all 5 down years would line up this way about 17% of the time by chance. Just 5 observations suggest a pattern that has a plausible story behind it (money leaves emerging markets in a panic); they don’t prove it will hold.
What this means for a rupee investor
Currency risk isn’t only about returns. If a goal is priced in dollars — a foreign degree, travel, a relative abroad — then holding rupee assets for it is the currency bet, and holding dollar assets reduces it. Whether foreign assets add or remove risk depends on what you’ll spend the money on.
It can also be hedged: a fund can use currency forwards to lock in an exchange rate. In textbook theory (covered interest parity) the cost of that hedge is roughly the gap between Indian and US interest rates, so a hedged dollar asset gives back much of the rupee’s average drift. Whether a particular international fund hedges is stated in its scheme documents; check rather than assume.
Common mistakes
- Treating rupee depreciation as extra return. Economic theory (purchasing power parity) links long-run currency moves to differences in inflation. In that view — and it’s a rough guide, not a law — a weakening rupee is largely compensation for higher Indian inflation, not a bonus. The 3.8% a year here doesn’t make dollar assets “better” — it makes their rupee returns look different.
- Assuming the rupee only goes one way. It strengthened in 6 of 20 years, by as much as 11.4% in one. Extrapolating a 20-year CAGR (compound annual growth rate) into next year is the same mistake as extrapolating any other trend.
- Comparing a foreign fund’s dollar return with an Indian fund’s rupee return. An international fund’s rupee NAV (net asset value) already includes the currency move. Compare rupee with rupee.
- Forgetting liabilities. A dollar goal funded with rupee savings carries currency risk even if you never buy a foreign asset.
Takeaway: A foreign investment’s rupee return is its own return multiplied by the exchange rate’s, and the exchange rate alone moved as much as 27.5% in a single year. Over two decades the rupee mostly weakened, but not every year. Know which currency your goals are in before deciding whether foreign assets add risk or remove it.
This post is for educational purposes only and is not investment advice. Wealth Primer explains concepts, not recommendations — nothing here is a suggestion to buy, sell, or hold any specific security or fund. The author is not a SEBI-registered Research Analyst or Investment Adviser. Any prices or figures used as worked examples are historical and shown only to illustrate a calculation. Past performance does not indicate future results. Please do your own research or consult a registered adviser before making investment decisions. See the privacy & disclaimer policy for more.