
Risk, Leverage and Your Own Brain · Part 13 of 16
Inflation and real returns: what your money actually bought
The risk that doesn’t show up on a statement
A fixed deposit statement never shows a loss. A savings account never has a bad year. And yet money in both can lose ground every year, because the thing it’s measured against — what a rupee buys — keeps moving. That’s inflation risk: the chance that your money grows more slowly than prices, so that you end up with more rupees and less to spend them on.
The number that captures it is the real return: the return after inflation. It’s the only return that tells you whether you’re actually better off. This post computes it for three things this blog has data on, over the longest stretch the current inflation series allows.
The formula
Inflation over a year  =  CPI at the end / CPI at the start  −  1

Real return  =  (1 + nominal return) / (1 + inflation)  −  1
             ≈  nominal return − inflation               (only for small numbers)

Rupees needed today to match ₹1 then  =  CPI today / CPI then
CPI is the Consumer Price Index: the price of a fixed basket of goods and services an average household buys, published monthly by MoSPI (the Ministry of Statistics and Programme Implementation). The exact formula matters when numbers are large: in FY21 the index fund’s 72.1% nominal return, with 5.5% inflation, was a 63.1% real return, not 66.6%.
🧒 Explain it like I'm 10 (optional — skip if this is already clear)
Last summer ₹100 bought you 5 ice creams at ₹20 each. You saved the ₹100 in a box and it grew to ₹104 by this summer. Nice!
But ice cream now costs ₹22. Your ₹104 buys 4 ice creams, with ₹16 left over. You have more money and fewer ice creams. The “real” question isn’t how many rupees you have — it’s how many ice creams they buy.
The data, and one wrinkle
Inflation: the All-India CPI (General index, Combined), from MoSPI (our CSV). The series used here starts in January 2013, so the comparison runs over 13 financial years, FY14 to FY26 (March 2013 to March 2026). The wrinkle: MoSPI moved CPI to a new base year (2024 = 100) with its release of 12 February 2026, and publishes a linking factor (0.5267 for the Combined index) to join the old series to the new one. We chain year-on-year changes instead: FY14 to FY25 within the old base-2012 series, and FY26 within the new one. Each year’s rate is then exactly MoSPI’s published March inflation.
Returns, all pre-tax, each year from 31 March to 31 March:
- Index fund — UTI Nifty 50 Index Fund, regular plan growth NAV (net asset value; AMFI, the Association of Mutual Funds in India, via mfapi.in).
- Gilt fund — UTI Gilt Fund, regular plan growth NAV (AMFI via mfapi.in); a fund of government bonds, see the debt funds post.
- Fixed deposit (FD) — a one-year deposit with SBI (State Bank of India), opened each 1 April at the rate SBI was paying the general public that day, compounded quarterly, and rolled into a new one-year deposit each year. Rates from SBI’s historical rate sheet and its deposit rate page.
Historical data to 31 March 2026, for illustration only.
Worked example: 13 years, year by year
| Year | CPI inflation | SBI 1-yr rate | Index fund | Gilt fund | FD | Index fund, real | Gilt fund, real | FD, real |
|---|---|---|---|---|---|---|---|---|
| FY14 | 8.2% | 8.75% | 18.1% | 3% | 9% | 9.1% | −4.9% | 0.7% |
| FY15 | 5.3% | 9% | 27.5% | 21.3% | 9.3% | 21.1% | 15.3% | 3.9% |
| FY16 | 4.8% | 8.5% | −8.1% | 3.9% | 8.8% | −12.4% | −0.9% | 3.8% |
| FY17 | 3.9% | 7.25% | 19.5% | 17% | 7.4% | 15% | 12.7% | 3.4% |
| FY18 | 4.3% | 6.9% | 11.5% | 3.1% | 7.1% | 6.9% | −1.1% | 2.7% |
| FY19 | 2.9% | 6.4% | 16% | 7.3% | 6.6% | 12.8% | 4.3% | 3.6% |
| FY20 | 5.8% | 6.8% | −25.4% | 12.6% | 7% | −29.5% | 6.4% | 1.1% |
| FY21 | 5.5% | 5.7% | 72.1% | 6.5% | 5.8% | 63.1% | 1% | 0.3% |
| FY22 | 7% | 5% | 19.8% | 2.7% | 5.1% | 12% | −4% | −1.7% |
| FY23 | 5.7% | 5.1% | 0.3% | 4.9% | 5.2% | −5.1% | −0.7% | −0.4% |
| FY24 | 4.9% | 6.8% | 29.6% | 8% | 7% | 23.6% | 3% | 2% |
| FY25 | 3.3% | 6.8% | 6.3% | 8.8% | 7% | 2.8% | 5.2% | 3.5% |
| FY26 | 3.4% | 6.8% | −4.3% | 2.7% | 7% | −7.4% | −0.7% | 3.5% |
And over the whole period:
| FY14–FY26 | Index fund | Gilt fund | Fixed deposit |
|---|---|---|---|
| Nominal return, a year (CAGR, compound annual growth rate) | 12% | 7.7% | 7.1% |
| Real return, a year | 6.7% | 2.6% | 2% |
| ₹1 lakh became (rupees) | 4,34,915 | 2,62,119 | 2,43,538 |
| …in March-2013 rupees | 2,31,113 | 1,39,290 | 1,29,416 |
| Years with a negative real return | 4 of 13 | 6 of 13 | 2 of 13 |
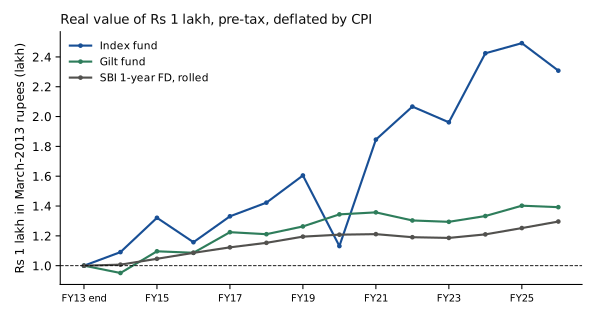
What the tables say:
- Prices rose 88% in 13 years — 5% a year. You needed ₹1,88,183 in March 2026 to buy what ₹1,00,000 bought in March 2013. At that pace prices double roughly every 14.3 years.
- Every one of the three beat inflation over the full period, pre-tax. The FD’s ₹1 lakh grew to ₹2,43,538 on paper but ₹1,29,416 in purchasing power: a real gain of about 2% a year, not 7.1%.
- The index fund had the highest real return and by far the deepest losing year: a real return of −29.5% in FY20. Its real return was negative in 4 years, the gilt fund’s in 6, the FD’s in 2 (FY22 and FY23, when the deposit rate sat below inflation). Real return and real risk came together.
- The gilt fund’s real return was barely above the FD’s, with more losing years — the interest-rate risk the modified duration post describes, showing up as real losses in the years its nominal return was low.
What “pre-tax” hides
Every figure above is before tax, and that flatters the FD most. FD interest is generally taxed year by year as it accrues, while fund gains are taxed when you sell, under different rules; the tax series covers how each is taxed. After tax, a deposit whose pre-tax real return is about 2% a year can end up close to zero or below it, depending on your slab. The funds’ figures are regular-plan NAVs, so they’re already after the expense ratio; direct plans would show a little more.
Common mistakes
- Subtracting instead of dividing. For a big year the shortcut breaks: nominal minus inflation overstates the real return. Use the division.
- Treating “no loss” as “safe”. The FD never showed a nominal loss, and still lost purchasing power in 2 years. Inflation risk is invisible on a statement by design.
- Assuming CPI is your inflation. CPI is an all-India average basket. A household whose spending tilts to school fees, rent or healthcare can see a very different number. For a long goal, the relevant inflation is the one for that goal.
- Comparing a real return with a nominal one. “The index fund did 12% a year” and “my FD’s real return was 2%” are different kinds of number. Convert both, or neither.
Takeaway: A return only means something after inflation, and inflation compounds quietly — prices rose 88% in 13 years here. Over that stretch, pre-tax, a rolled SBI FD earned about 2% a year in real terms and an index fund about 6.7%, with much deeper bad years. Check what your money buys, not how many rupees it shows.
This post is for educational purposes only and is not investment advice. Wealth Primer explains concepts, not recommendations — nothing here is a suggestion to buy, sell, or hold any specific security or fund. The author is not a SEBI-registered Research Analyst or Investment Adviser. Any prices or figures used as worked examples are historical and shown only to illustrate a calculation. Past performance does not indicate future results. Please do your own research or consult a registered adviser before making investment decisions. See the privacy & disclaimer policy for more.
Tax rules are described as at August 2026 and may have changed since. The author is not a tax professional, and this post is not tax advice. Confirm the current position, and how it applies to you, with a qualified tax professional before you act.