
Risk, Leverage and Your Own Brain · Part 2 of 16
The arithmetic of losses: why −50% needs +100%
Two facts that are easy to know and hard to feel
The last post was about a base rate. This one is about arithmetic — two pieces of it that every investor “knows” and almost nobody prices in.
Fact one: losses and gains are not symmetric. Lose half your money and a 50% gain does not get you back. You need 100%.
Fact two: the average return is not the return you get. A fund whose yearly returns average 13% does not turn ₹1 lakh into what 13% a year would. It turns it into less — and the bouncier the ride, the bigger the gap.
Neither is a market opinion. Both are consequences of multiplication, and both show up in real data.
The formula
Gain needed to recover from a loss L (as a fraction):

    G  =  1 / (1 − L)  −  1

Volatility drag (approximation):

    Geometric mean  ≈  Arithmetic mean  −  σ² / 2

where σ is the standard deviation of the periodic returns.
σ (sigma) is the standard deviation — a measure of how widely returns swing around their own average.
Part one: the recovery table
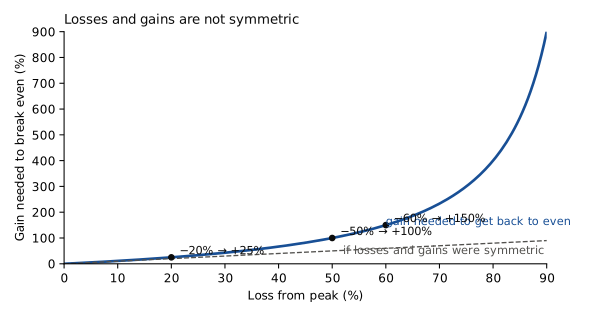
| Loss from peak | Gain needed to break even |
|---|---|
| −10% | +11.1% |
| −20% | +25.0% |
| −30% | +42.9% |
| −40% | +66.7% |
| −50% | +100.0% |
| −60% | +150.0% |
| −70% | +233.3% |
| −80% | +400.0% |
| −90% | +900.0% |
The curve bends upward, and it bends hard. A 10% loss needs an 11% gain — close enough to symmetric that you’d never notice. A 50% loss needs 100%. A 90% loss needs a tenfold rise.
This is why the drawdown post made such a point of recovery time. When UTI Nifty 50 Index Fund fell 59.7% from its January 2008 peak, getting back did not require a 59.7% rise. It required +148.1% — which is why the wait was nearly six years for this fund’s regular-plan NAV, even though the year right after the crash was spectacular (+71.8% in FY10). The Nifty itself briefly touched its January 2008 close in November 2010, then fell away again.
🧒 Explain it like I'm 10 (optional — skip if this is already clear)
You have 100 marbles. You lose half — 50 left. Now you win back “half” — half of what you have, which is 25. You’ve got 75. You lost 50 and won 50%, and you’re still 25 short.
To get back to 100 from 50 you need to double what you have. Losing half and winning half aren’t opposites, because “half” is measured from a smaller pile the second time.
Part two: the average that lies
Here are the financial-year returns of UTI Nifty 50 Index Fund’s Regular Plan - Growth (AMFI scheme code 100822) for every full year in the data — 1 April to 31 March, 20 years:
| Year | Return | Item | Year | Return |
|---|---|---|---|---|
| FY07 | 11.0% | FY17 | 19.5% | |
| FY08 | 22.0% | FY18 | 11.5% | |
| FY09 | −36.3% | FY19 | 16.0% | |
| FY10 | 71.8% | FY20 | −25.4% | |
| FY11 | 10.7% | FY21 | 72.1% | |
| FY12 | −9.4% | FY22 | 19.8% | |
| FY13 | 7.8% | FY23 | 0.3% | |
| FY14 | 18.1% | FY24 | 29.6% | |
| FY15 | 27.5% | FY25 | 6.3% | |
| FY16 | −8.1% | FY26 | −4.3% |
Source: AMFI via mfapi.in, data to 31 March 2026. Historical data, for illustration only.
Add those twenty numbers up and divide by twenty:
| Item | |
|---|---|
| Arithmetic mean of the yearly returns | 13.03% |
| Actual compound annual growth (CAGR) | 10.2% |
| Gap — the volatility drag | 2.83 percentage points |
| Standard deviation of yearly returns | 25.5% |
| σ²/2 approximation of the drag | 3.26 percentage points |
The fund’s yearly returns averaged 13.03%. Its actual growth rate — the CAGR the point-to-point returns post defined — was 10.2%. That is 2.83 percentage points a year that went missing, and nobody took them. They were consumed by the bouncing.
Put money on it:
| ₹1,00,000 invested for 20 years | Ends at |
|---|---|
| If it had grown at the 13.03% “average” every year | ₹11,58,213 |
| What it actually became (NAV 22.0557 → 153.8204) | ₹6,97,418 |
The “average return” version is worth about 66% more than the real one. Same twenty years, same fund. The only difference is that one number describes what happened and the other describes something that never did.
Why the bouncing costs money
Look at FY09 and FY10 in the table. FY09 was −36.3%; the next year was +71.8%, the second-best year in twenty. The arithmetic average of those two years is a healthy +17.8% a year.
Compound them instead — which is what your money actually does:
(1 − 0.363) × (1 + 0.718) = 0.637 × 1.718 = 1.095
Two years, a 9.5% total gain. About 4.6% a year, not 17.8%. A fall followed by an even larger rise still left the investor barely ahead, because the rise was earned on the smaller, post-fall amount. That is the recovery table from part one, and it is the whole mechanism of volatility drag: the more a return series swings, the more of its arithmetic average gets eaten on the way to becoming an actual compound return.
The σ²/2 shortcut tells you roughly how much. Yearly returns with a standard deviation of 25.5% should lose about 3.26 percentage points to drag; the real gap was 2.83. Close enough to be useful, and it means one thing very directly: two investments with the same average return are not equal. The smoother one compounds faster. This is the arithmetic underneath the Sharpe ratio — volatility isn’t just uncomfortable, it’s expensive.
Doing it in Python
import pandas as pd

nav = pd.read_csv("uti-nifty50-index-fund-nav.csv",
                  parse_dates=["date"]).set_index("date")
r = nav.nav_regular_growth.dropna()

# financial-year (Apr-Mar) returns
fy = r.groupby(r.index.to_period("Q-MAR").asfreq("Y-MAR")).last()
fy = pd.concat([pd.Series({fy.index[0] - 1: r.iloc[0]}), fy])
ret = fy.pct_change().dropna()

arith = ret.mean()
geo = (r.iloc[-1] / r.iloc[0]) ** (1 / len(ret)) - 1
print(f"arithmetic {arith:.2%}  geometric {geo:.2%}  "
      f"drag {arith - geo:.2%}  approx {ret.std(ddof=0)**2 / 2:.2%}")

# the recovery table
for loss in (0.1, 0.2, 0.5, 0.6, 0.9):
    print(f"-{loss:.0%} needs +{1 / (1 - loss) - 1:.0%}")
Common mistakes
- Mentally netting a −20% year against a +20% year. They don’t cancel. You’re down 4%.
- Compounding an “average return” forward. Any projection built on an arithmetic average of past yearly returns overstates the result, and by more the bouncier the asset. Use the CAGR.
- Treating volatility as merely emotional. It has a rupee cost: the same average return with a higher standard deviation compounds to less.
- Assuming a big up-year has “repaired” a big down-year. +71.8% after −36.3% left the investor up 9.5% over two years. Look at the level, not the headline.
- Forgetting this applies to your own trading. Every leveraged position, every stop-loss hit and re-entry, every drawdown in a trading account is a small version of the recovery table. The next two posts are about exactly that.
Takeaway: Losing half needs a double to recover, and a fund whose yearly returns averaged 13.03% actually compounded at 10.2% — the 2.83 points in between were eaten by volatility, not by anyone. Avoiding large losses isn’t caution for its own sake; it’s the fastest way to compound.
This post is for educational purposes only and is not investment advice. Wealth Primer explains concepts, not recommendations — nothing here is a suggestion to buy, sell, or hold any specific security or fund. The author is not a SEBI-registered Research Analyst or Investment Adviser. Any prices or figures used as worked examples are historical and shown only to illustrate a calculation. Past performance does not indicate future results. Please do your own research or consult a registered adviser before making investment decisions. See the privacy & disclaimer policy for more.