
Risk, Leverage and Your Own Brain · Part 6 of 16
Sequence-of-returns risk: the same twenty years, in a different order
A risk that doesn’t show up in any return figure
Most return statistics on this blog — point-to-point CAGR (compound annual growth rate), rolling returns, volatility, the Sharpe ratio — are computed from a sequence of returns, and none of them cares about the order of that sequence. Shuffle twenty years of annual returns and the CAGR is identical. So is the volatility. (XIRR, the extended internal rate of return, is the exception: it’s built from your own cash flows, so order matters to it — which is exactly why two SIP investors in the same fund can end up with very different XIRRs.)
Your money, however, cares enormously — as long as money is moving in or out along the way. A crash in year one of a SIP and a crash in year twenty are the same return statistic and completely different outcomes. That gap is sequence-of-returns risk, and it’s the reason the SIP post’s Jan 2007 investor and its twenty-year investor had such different experiences with the same fund.
The setup
Take UTI Nifty 50 Index Fund’s Regular Plan - Growth (AMFI scheme code 100822) and its 20 financial-year returns, FY07 to FY26 — the same twenty numbers the arithmetic of losses post tabulated. Source: AMFI via mfapi.in, data to 31 March 2026. Historical data, for illustration only.
Now run them in three orders:
| Order | First three years | Last three years |
|---|---|---|
| Actual (FY07 → FY26) | 11.0%, 22.0%, −36.3% | 29.6%, 6.3%, −4.3% |
| Best years first | 72.1%, 71.8%, 29.6% | −9.4%, −25.4%, −36.3% |
| Worst years first | −36.3%, −25.4%, −9.4% | 29.6%, 71.8%, 72.1% |
Same twenty returns in every row. Same average, same CAGR, same volatility.
Case one: a lump sum doesn’t care
₹1,00,000 invested at the start and left alone for 20 years ends at ₹6,97,418 in all three orders. Multiplication commutes: (1+a)(1+b) is (1+b)(1+a). If nothing goes in or out, the order of returns is irrelevant to where you end up — and the CAGR on every factsheet you’ve ever read is silently a lump-sum statistic.
Case two: a SIP cares a great deal
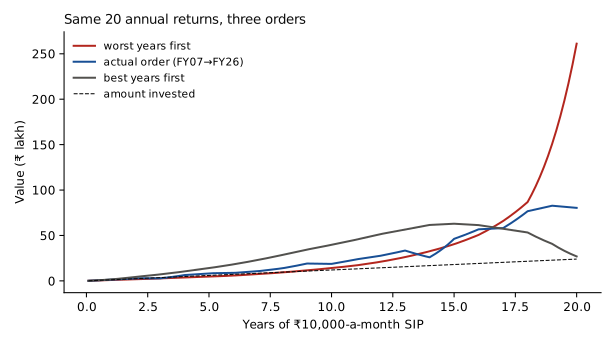
Now put ₹10,000 a month in for the same twenty years — ₹24,00,000 in total, each year’s return applied evenly across its twelve months:
| Order | Final value |
|---|---|
| Actual | ₹80,38,300 |
| Best years first | ₹26,92,584 |
| Worst years first | ₹2,61,12,775 |
The actual-order figure differs a little from the SIP post’s ₹77.8 lakh on ₹23.9 lakh of real instalments, because this model spreads each year’s return evenly across its months instead of using real daily NAVs.
9.7 times. Not 9.7% — close to a factor of ten between the best and worst ordering of exactly the same returns.
The reason is mechanical. With a SIP, most of your money is in the fund during the later years — the last year’s returns act on twenty years of accumulated contributions, the first year’s on a few months’ worth. So the late returns dominate. Worst-years-first puts −36.3% on almost nothing and +72.1% on the full pile. Best-years-first does the reverse, and turns ₹24 lakh of contributions into barely ₹27 lakh.
Notice which way this cuts. For someone accumulating, an early crash is the good sequence — cheap units when the pile is small, growth when it’s large. The Jan 2007 SIP investor from the earlier post lived through the bad version. The 2008 crash came early, while the pile was small — that part helped. What hurt was the slide through 2011, in years four and five, when the pile was at its largest: the fund returned −9.4% in FY12, and five years of contributions ended with a return of nothing. They weren’t unlucky about what happened. They were unlucky about when.
🧒 Explain it like I'm 10 (optional — skip if this is already clear)
Suppose you get ₹10 pocket money every week and keep it in a jar. Some weeks a magic jar doubles what’s inside; some weeks it halves it.
If the halving weeks come first, they hurt a jar with ₹10 or ₹20 in it — no big deal. The doubling weeks then come when the jar is full. Great.
If the doubling weeks come first, they double ₹10 into ₹20 — nice, but small. Then the halving weeks come when the jar has hundreds in it. Ouch.
Same number of doublings and halvings. The order decides whether you end up rich or annoyed.
Case three: a retiree cares in the opposite direction
Flip the cash flows. Start with ₹50,00,000 and withdraw ₹30,000 a month — an SWP, a Systematic Withdrawal Plan — for twenty years, against the same three orderings:
| Order | Balance after 20 years |
|---|---|
| Actual | ₹1,07,55,995 |
| Best years first | ₹2,67,93,142 |
| Worst years first | ₹0 — money ran out after about 6.4 years |
Now the early years dominate, because that’s when the pile is largest and the withdrawals are eating into a falling balance. The ordering that was best for the saver is fatal for the spender: worst-years-first empties the account in about 6.4 years, while best-years-first leaves it 5.4 times its starting size after two decades of withdrawals.
This is why the drawdown post’s recovery times matter so much more to someone withdrawing than to someone accumulating. A six-year recovery is a long wait when you’re adding money. It’s a hole you may never climb out of when you’re taking money out every month during the fall.
What you can actually do about it
You can’t choose your sequence. You can change how exposed you are to it:
- When accumulating, sequence risk is mostly on your side — early crashes help. The exposure is in the last few years before you need the money, when the pile is largest. That’s the honest case for gradually reducing equity as a goal approaches (how much depends on your circumstances): not because returns will be worse, but because a bad sequence at that point can’t be waited out.
- When withdrawing, the first few years are everything. A cash buffer covering a couple of years of withdrawals, so that a crash early in retirement is met by spending cash rather than selling units at the low, is the standard defence; the right size depends on your circumstances. It costs return in good sequences and saves the portfolio in bad ones.
- Judge SIP outcomes with this in mind. Two people, same fund, same monthly amount, same discipline, five years apart — very different XIRRs. Neither is a verdict on the fund or on the habit.
Doing it in Python
import pandas as pd, numpy as np

nav = pd.read_csv("uti-nifty50-index-fund-nav.csv",
                  parse_dates=["date"]).set_index("date").nav_regular_growth.dropna()
fy = nav.groupby(nav.index.to_period("Q-MAR").asfreq("Y-MAR")).last()
fy = pd.concat([pd.Series({fy.index[0] - 1: nav.iloc[0]}), fy])
annual = fy.pct_change().dropna().values          # 20 FY returns

def sip(returns, monthly=10000):
    v = 0.0
    for R in returns:
        m = (1 + R) ** (1/12) - 1
        for _ in range(12):
            v = (v + monthly) * (1 + m)
    return v

for name, seq in {"actual": annual,
                  "best first": np.sort(annual)[::-1],
                  "worst first": np.sort(annual)}.items():
    print(f"{name:12s} SIP ends at Rs {sip(seq):,.0f}   "
          f"lump sum x{np.prod(1 + seq):.2f}")
The lump-sum multiple prints the same number three times. The SIP doesn’t. That contrast is the entire post.
Common mistakes
- Using a fund’s CAGR to project a SIP or a retirement. CAGR is order-blind. Your cash flows aren’t.
- Concluding a SIP “didn’t work” from a bad five-year stretch. The same contributions in a different order would have compounded fine. The habit wasn’t the problem; the sequence was.
- Holding the same asset mix while saving and while spending. The two face opposite sequence risks. Early volatility helps one and can ruin the other.
- Treating a big final pot as proof of skill. Someone whose best years landed last did well partly because of when they were born. So did someone whose crash came first.
- Assuming a cash buffer is “wasted” return. It is, in good sequences. It’s the only thing that works in bad ones, and you don’t get to know which you’ll have.
Takeaway: Twenty real annual returns, reordered, take the same ₹10,000-a-month SIP anywhere from ₹27 lakh to ₹2.6 crore — and empty or multiply 5.4-fold a retiree’s ₹50 lakh — while a lump sum ends at the same figure every time. Returns don’t care about order. Money moving in or out does, and the years when the most money is exposed are the ones that decide.
This post is for educational purposes only and is not investment advice. Wealth Primer explains concepts, not recommendations — nothing here is a suggestion to buy, sell, or hold any specific security or fund. The author is not a SEBI-registered Research Analyst or Investment Adviser. Any prices or figures used as worked examples are historical and shown only to illustrate a calculation. Past performance does not indicate future results. Please do your own research or consult a registered adviser before making investment decisions. See the privacy & disclaimer policy for more.