
Technical Analysis — Zero to Hero · Part 6 of 22
Volume: how much conviction was behind the move
The second dimension
Every chart so far in this series has been about price. But each bar carries a second number that most beginners scroll past: volume, the number of shares that changed hands.
Price tells you where buyers and sellers agreed. Volume tells you how many of them were involved in the agreement. A 3% rise on a quiet Tuesday and a 3% rise on the heaviest trading day of the year are the same move on a line chart and very different events.
The standard framing is that volume measures conviction. That’s a decent intuition, but it needs one correction immediately, because it’s the thing almost everyone gets wrong.
Every trade has two sides
You will constantly read that “buying volume” pushed a stock up, or that “selling volume” drove it down. Taken literally this is nonsense: every share bought was sold by someone. Volume is not a measure of buyers exceeding sellers, because buyers can never exceed sellers. They match exactly, always.
What volume actually measures is participation — how much the asset changed hands. High volume means many people revised their view enough to act on it. It says nothing, by itself, about which direction they were leaning.
Hold onto that, because the chart below makes the point better than any argument could.
🧒 Explain it like I'm 10 (optional — skip if this is already clear)
Imagine a school playground where kids swap trading cards.
The price is how many sweets one card is worth today. The volume is how many cards actually got swapped.
If one card gets swapped and the price jumps, maybe two kids were being silly. If four hundred cards get swapped and the price jumps, something real happened — a rumour that the card is being discontinued, maybe.
But here’s the catch: for every kid who got a card, another kid gave one away. So a busy day doesn’t mean everyone wanted to buy. It means everyone wanted to trade. Those are different things.
The conventional readings
The usual claims about volume, stated as most sources state them:
| Pattern | Conventional reading |
|---|---|
| Price rises on rising volume | Move has participation behind it |
| Price rises on falling volume | Fewer participants; move may be running out |
| Price falls on rising volume | Selling has conviction behind it |
| Volume spike at an extreme | Possible exhaustion — the last of the crowd acting |
| Breakout on heavy volume | More persuasive than a breakout on light volume |
That last row is the one with the most practical use. A price pushing through a resistance zone on triple the usual volume means a lot of people participated in that decision. The same breakout on thin volume could be a handful of orders in a quiet session.
Now here is where the conventional readings meet reality.
The chart, and the day that breaks the story
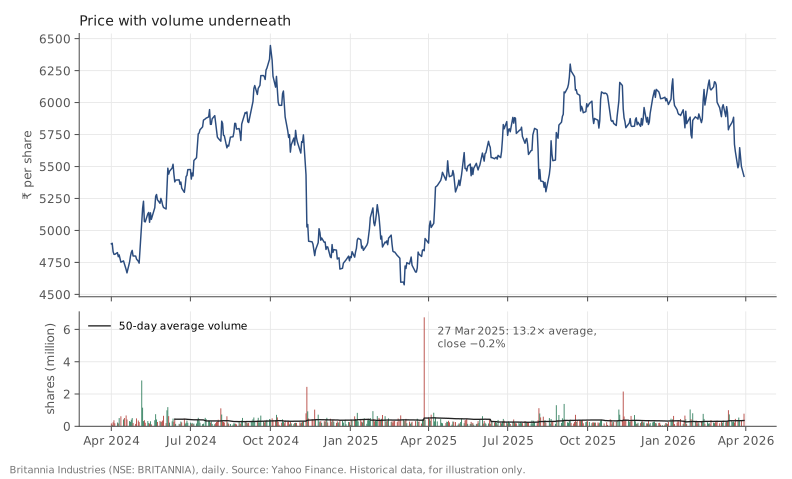
Britannia (NSE: BRITANNIA), daily bars, 1 April 2024 to 30 March 2026. Source: Yahoo Finance. Historical data, for illustration only.
Every volume spike above three times the 50-day average, across two years:
| Date | Volume | vs 50-day avg | Close | Day’s move |
|---|---|---|---|---|
| 2024-08-05 | 11,14,298 | 3.3x | ₹5,697.90 | −0.4% |
| 2024-11-12 | 24,41,209 | 6.7x | ₹5,027.55 | −7.5% |
| 2025-03-27 | 67,50,074 | 13.2x | ₹4,841.20 | −0.2% |
| 2025-08-06 | 11,23,534 | 4.0x | ₹5,402.50 | −4.1% |
| 2025-08-26 | 13,07,463 | 4.0x | ₹5,765.50 | +3.9% |
| 2025-09-04 | 13,85,580 | 3.8x | ₹6,083 | +3.0% |
| 2025-11-11 | 21,54,927 | 5.7x | ₹5,950.50 | −3.0% |
| 2026-01-27 | 10,44,402 | 3.6x | ₹5,886 | +0.9% |
Look at 27 March 2025. It is by a wide margin the largest volume day in the dataset — 13.2 times the average — over 67 lakh shares against a median day of about 2,96,000. If volume signalled direction, something dramatic should have happened.
The close moved −0.2%.
Enormous participation, no price change. The likely reason: it was the last session before Britannia’s exit from the Nifty 50 took effect on 28 March 2025 (NSE Indices announced the change on 21 February 2025, effective from the close of 27 March), so index funds tracking the Nifty had to sell at that day’s close — and the price barely noticed, because that selling had been known for weeks and buyers were lined up to match it.
Contrast it with 12 November 2024, the session after Britannia reported a fall in its Q2 FY25 (July–September 2024 quarter) profit: 6.7 times average volume and a −7.5% day. Same category of signal on a volume screen; completely different event.
Volume tells you how many. It does not tell you which way. You need the price to tell you that, and you need the news to tell you why.
Volume in Indian markets: two practical cautions
Delivery volume matters. Indian exchanges publish delivery percentage — the share of traded volume that resulted in actual delivery rather than being squared off intraday. A day with huge volume but 20% delivery is mostly day traders passing shares around; 70% delivery means people took real positions. NSE and BSE both publish this, and it’s more informative than raw volume.
Volume is exchange-specific. A stock listed on both NSE and BSE has separate volume on each. Charts usually show one. It’s rarely a problem for large caps, where NSE dominates, but it’s worth knowing what your chart is counting.
Doing it in Python
import pandas as pd

df = pd.read_csv("britannia-ohlcv-2024-04-to-2026-03.csv",
                 parse_dates=["date"]).set_index("date")

df["vol_avg50"] = df.volume.rolling(50).mean()
df["vol_ratio"] = df.volume / df.vol_avg50
df["day_move"]  = df.close.pct_change() * 100

spikes = df[df.vol_ratio > 3]
print(spikes[["volume", "vol_ratio", "close", "day_move"]].round(2))
The always-useful comparison is volume relative to its own recent average, never volume in absolute terms. Half a million shares is enormous for one stock and a quiet morning for another.
Common mistakes
- Talking about “buying volume” and “selling volume.” Every trade has a buyer and a seller. Volume measures participation, not the balance of intent.
- Reading a volume spike as directional. As 27 March 2025 shows plainly, the largest volume day in two years moved the close by −0.2%.
- Comparing raw volume across stocks. Only the ratio to that stock’s own average means anything.
- Ignoring index rebalancing, block deals, and expiry days. These generate enormous volume for structural reasons that have nothing to do with anyone’s view of the company.
- Forgetting the delivery percentage. High volume with low delivery is churn, not accumulation.
- Expecting volume to confirm on demand. Plenty of genuine, durable moves happen on unremarkable volume. Absence of a volume spike is not evidence against a move.
Takeaway: Volume measures how many shares changed hands, which is participation — not the balance of buyers over sellers, because that balance is always exactly zero. Compare it to the stock’s own recent average, use it to judge how many people were involved in a move, and remember the largest volume day in this entire dataset moved the price by two-tenths of a percent.
This post is for educational purposes only and is not investment advice. Wealth Primer explains concepts, not recommendations — nothing here is a suggestion to buy, sell, or hold any specific security or fund. The author is not a SEBI-registered Research Analyst or Investment Adviser. Any prices or figures used as worked examples are historical and shown only to illustrate a calculation. Past performance does not indicate future results. Please do your own research or consult a registered adviser before making investment decisions. See the privacy & disclaimer policy for more.