
Technical Analysis — Zero to Hero · Part 18 of 22
Seasonality myths, part two: Budget day and Muhurat trading
Two dates the market talks about every year
The first seasonality post tested calendar months. This one tests two dates that are specifically Indian and come with a lot of commentary:
- Union Budget day. Every year TV channels run “Budget-day market” specials, and there’s a popular belief that the market usually falls on the day, or at least moves a lot.
- Muhurat trading. On Diwali evening, the exchanges hold a special session of about an hour, traditionally seen as an auspicious start to the new year. Some investors buy a token amount for luck, and a common line is that the market “usually closes green” in that session.
Both are claims about a specific date, so they need correct dates. That turns out to be half the work.
Getting the dates right
A test on the wrong dates is worse than no test. So every date here comes from a primary source, checked in September 2026:
- Budget dates come from the date printed on each Budget speech on indiabudget.gov.in (for 2008, the Press Information Bureau’s release of that day). That’s 23 Budgets from 2008 to 2026, including the interim Budgets in election years and the full Budgets that followed them.
- Weekend Budgets were presented on a Saturday or Sunday 4 times. For each, NSE issued a circular announcing a live trading session that day: NSE/CMTR/28939 (for 28 February 2015), NSE/CMTR/43290 (1 February 2020), NSE/CMTR/65729 (1 February 2025) and NSE/CMTR/72349 (1 February 2026).
- Muhurat sessions come from NSE’s equity-segment circulars, one per year, 18 sessions from 2008 to 2025. They’re listed in full further down.
Then we check what the price file actually contains. The Nifty data here is the Nifty 50 price index from Yahoo Finance, 17 September 2007 to 30 March 2026. It has no row for 4 of the Budget days, and none for 12 of the 18 Muhurat sessions. Many of these are weekend sessions the feed skipped. Every missing date is listed below rather than quietly dropped.
The formula
Event-day move = Nifty close on the event day / previous close − 1

Compared with every trading day in the file:
   size:       average |move| on event days  vs  average |move| on all days
   direction:  rises and falls on event days  vs  share of all days that rose

Shuffle test: draw the same number of random trading days 10,000 times.
   How often is a random set at least as extreme as the event days?
Budget day: bigger moves, not a reliable direction
Across 4,545 trading days, the Nifty’s average move (up or down) was 0.86%, and it rose on 53% of days. The 19 Budget days with a row in the file:
| Item | Budget days | All days |
|---|---|---|
| Days | 19 | 4,545 |
| Average size of the move, up or down | 1.39% | 0.86% |
| Median size of the move | 1.14% | 0.59% |
| Rose | 6 of 19 (32%) | 53% |
| Average move | −0.3% | 0.04% |
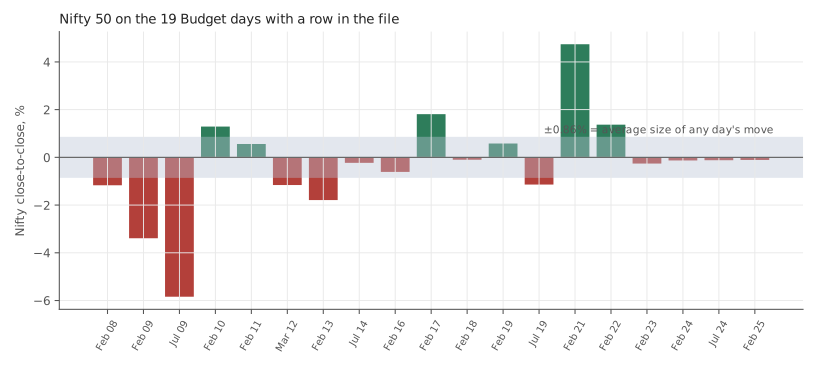
Nifty 50 price index. Source: Yahoo Finance. Historical data, for illustration only.
Size. Budget days moved more than ordinary days. In the shuffle test, only 2.5% of random sets of 19 days had an average move as large. That is the one result in this post that looks reasonably solid. But there’s a catch. Two of the biggest moves came in 2009, when every day was volatile. So we also compared each Budget day with the average move of the 20 sessions before it. Budget days were bigger than their own recent average 10 times out of 19 (53%). For all days the figure is 42%. So the effect survives the check, but it’s smaller than the raw averages suggest.
Direction. 13 falls and 6 rises. In the shuffle test, 5% of random sets of 19 days had at least as many falls. That’s worth noticing, but it isn’t much to go on. It’s 19 days. The biggest fall (6 July 2009, down 5.84%) and the biggest rise (1 February 2021, up 4.74%) both sit in the table. And “Budget day tends to fall” would not have told you which kind of year you were in.
| Date | Day | Budget | Nifty move | Bigger than this % of all days |
|---|---|---|---|---|
| 2008-02-29 | Friday | Full | −1.17% | 77% |
| 2009-02-16 | Monday | Interim | −3.39% | 97% |
| 2009-07-06 | Monday | Full | −5.84% | 100% |
| 2010-02-26 | Friday | Full | 1.29% | 80% |
| 2011-02-28 | Monday | Full | 0.56% | 48% |
| 2012-03-16 | Friday | Full | −1.16% | 77% |
| 2013-02-28 | Thursday | Full | −1.79% | 89% |
| 2014-07-10 | Thursday | Full | −0.23% | 22% |
| 2016-02-29 | Monday | Full | −0.61% | 51% |
| 2017-02-01 | Wednesday | Full | 1.81% | 89% |
| 2018-02-01 | Thursday | Full | −0.1% | 10% |
| 2019-02-01 | Friday | Interim | 0.58% | 49% |
| 2019-07-05 | Friday | Full | −1.14% | 76% |
| 2021-02-01 | Monday | Full | 4.74% | 99% |
| 2022-02-01 | Tuesday | Full | 1.37% | 82% |
| 2023-02-01 | Wednesday | Full | −0.26% | 25% |
| 2024-02-01 | Thursday | Interim | −0.13% | 13% |
| 2024-07-23 | Tuesday | Full | −0.12% | 12% |
| 2025-02-01 | Saturday | Full | −0.11% | 11% |
The last column ranks each Budget-day move, by size, among all 4,545 trading days. A value of 50% would be a perfectly ordinary day.
Not in the file. For these Budget days the file has no row. The move shown runs from the last close before the Budget to the first close after it, so it includes a second session. It’s here for completeness and isn’t in any of the averages above.
| Budget date | Day | First close after | Move over both sessions |
|---|---|---|---|
| 2014-02-17 | Monday | 2014-02-18 | 1.3% |
| 2015-02-28 | Saturday | 2015-03-02 | 1.27% |
| 2020-02-01 | Saturday | 2020-02-03 | −2.13% |
| 2026-02-01 | Sunday | 2026-02-02 | −0.92% |
Three of these were weekend sessions the feed skipped. The fourth, 17 February 2014, was a Monday; the file simply has no row for it. Leaving these out makes the Budget-day numbers slightly less complete. Leaving them in as one-day moves would have made them wrong.
Muhurat trading: an hour, six data points
Here is every Muhurat session from 2008 to 2025, with NSE’s circular, and the Nifty’s move where the file has a row for it:
| Session | Day | Window (IST) | NSE circular | Nifty move |
|---|---|---|---|---|
| 2008-10-28 | Tuesday | 18:15–19:15 | NSE/CMTR/11371 | no row |
| 2009-10-17 | Saturday | 18:15–19:15 | NSE/CMTR/13174 | no row |
| 2010-11-05 | Friday | 18:15–19:00 | NSE/CMTR/16062 | no row |
| 2011-10-26 | Wednesday | 16:45–18:00 | NSE/CMTR/19187 | no row |
| 2012-11-13 | Tuesday | 15:45–17:00 | NSE/CMTR/22083 | no row |
| 2013-11-03 | Sunday | 18:15–19:30 | NSE/CMTR/24773 | no row |
| 2014-10-23 | Thursday | 18:30–19:30 | NSE/CMTR/27779 | no row |
| 2015-11-11 | Wednesday | 17:45–18:45 | NSE/CMTR/31047 | no row |
| 2016-10-30 | Sunday | 18:30–19:30 | NSE/CMTR/33424 | no row |
| 2017-10-19 | Thursday | 18:30–19:30 | NSE/CMTR/35993 | −0.63% |
| 2018-11-07 | Wednesday | 17:30–18:30 | NSE/CMTR/39216 | 0.65% |
| 2019-10-27 | Sunday | 18:15–19:15 | NSE/CMTR/42483 | no row |
| 2020-11-14 | Saturday | 18:15–19:15 | NSE/CMTR/46230 | no row |
| 2021-11-04 | Thursday | 18:15–19:15 | NSE/CMTR/50050 | 0.49% |
| 2022-10-24 | Monday | 18:15–19:15 | NSE/CMTR/54023 | 0.88% |
| 2023-11-12 | Sunday | 18:15–19:15 | NSE/CMTR/59124 | no row |
| 2024-11-01 | Friday | 18:00–19:00 | NSE/CMTR/64628 | 0.41% |
| 2025-10-21 | Tuesday | 13:45–14:45 | NSE/CMTR/70319 | 0.1% |
The file has rows for only 6 of the 18 sessions, all on weekdays from 2017 on. The weekend sessions and the earlier weekday ones aren’t in this feed. We haven’t substituted the next day’s close for them, because that would measure a full trading day, not the Muhurat hour.
On those 6, the Nifty rose 5 times and averaged +0.32%. That matches the folklore. But:
- Six is a very small number. In the shuffle test, 14% of random sets of six ordinary days had at least 5 rises. That’s far too common to call unusual.
- The moves were small. An average size of 0.53%, against 0.86% on an ordinary day. That’s what you’d expect from about an hour of thin, ceremonial trading.
- It’s one hour, then a new week. Even a reliable green hour wouldn’t be a reason to hold anything afterwards. The session is a tradition, and it’s worth enjoying as one.
🧒 Explain it like I'm 10 (optional — skip if this is already clear)
Imagine you notice your cricket team won the last five matches you watched wearing your lucky cap. Five wins in a row feels like proof.
But your team wins a lot of matches anyway. If you counted every match — cap or no cap — you might find they win just as often. And five matches is not many; a coin can land heads five times out of six more often than you’d think.
Budget day and Diwali trading are the market’s lucky caps. The only way to know if they matter is to count every one, and compare with all the ordinary days.
Doing it in Python
import pandas as pd

s = pd.read_csv("nifty50-price-index.csv", parse_dates=["date"]
                ).set_index("date").nifty50_pri_close
ret = s.pct_change().dropna()

budget_days = pd.to_datetime(["2021-02-01", "2022-02-01", "2023-02-01",
                              "2024-02-01", "2024-07-23", "2025-02-01"])
missing = budget_days.difference(ret.index)       # check before you trust it
print("not in file:", list(missing.date))
ev = ret.reindex(budget_days.intersection(ret.index))

print(f"Budget days: avg |move| {ev.abs().mean():.2%}, "
      f"all days {ret.abs().mean():.2%}, rises {(ev > 0).sum()} of {len(ev)}")
bigger = sum(ret.sample(len(ev), random_state=i).abs().mean() >= ev.abs().mean()
             for i in range(5000))
print(f"random sets as big: {bigger / 5000:.1%}")
Replace the six dates with the full verified list from the table above. The
missing line is the important habit: a date that isn’t in your file must be
dealt with openly, not skipped without a word.
Common mistakes
- Using dates from memory. Budgets moved from late February to 1 February in 2017. Election years have two. Some fell on weekends. Muhurat dates move with the Hindu calendar. Get every date from a primary source.
- Silently dropping days your data doesn’t have. A weekend session missing from a price feed can be one of the bigger moves (the 2020 Budget, a Saturday, is missing from this one). List what’s missing, and say why.
- Treating “bigger” as “predictable”. Budget days moved more than ordinary days. That tells you volatility is higher, not which way it goes. Higher volatility cuts both ways.
- Calling six observations a tradition that works. Five green sessions out of six sounds convincing. Random sets of six ordinary days did that 14% of the time.
Takeaway: On 18 years of Nifty data with verified dates, Budget days moved noticeably more than ordinary days, but not in a dependable direction. The “Muhurat closes green” belief rests on a handful of sessions, which random sets of days matched 14% of the time. Both dates say something about volatility, not about direction.
This post is for educational purposes only and is not investment advice. Wealth Primer explains concepts, not recommendations — nothing here is a suggestion to buy, sell, or hold any specific security or fund. The author is not a SEBI-registered Research Analyst or Investment Adviser. Any prices or figures used as worked examples are historical and shown only to illustrate a calculation. Past performance does not indicate future results. Please do your own research or consult a registered adviser before making investment decisions. See the privacy & disclaimer policy for more.